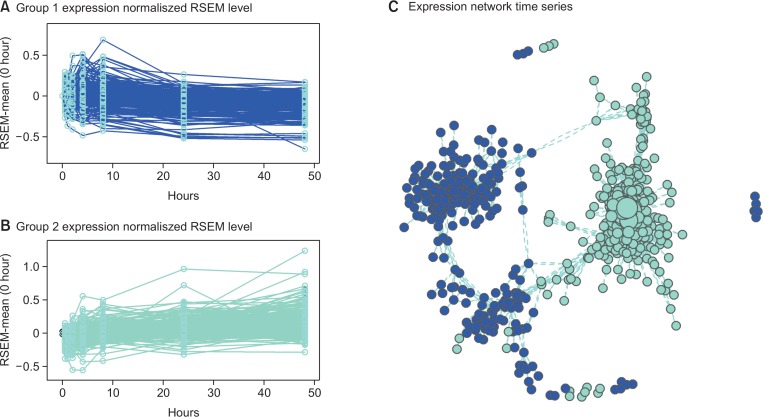
Fig. 2.
Visualization of differential expression gene sets (DEGs) in the two groups. (A) early stage expression from 30 min to 8 h and (B) the late stage expression pattern, which progressively increased after 8 h of infection. (C) A network graph showing correlated genes. The graph shows clear separation between the groups.

