Figure 1. Inner NE proteins are sequestered into distinct microdomains.
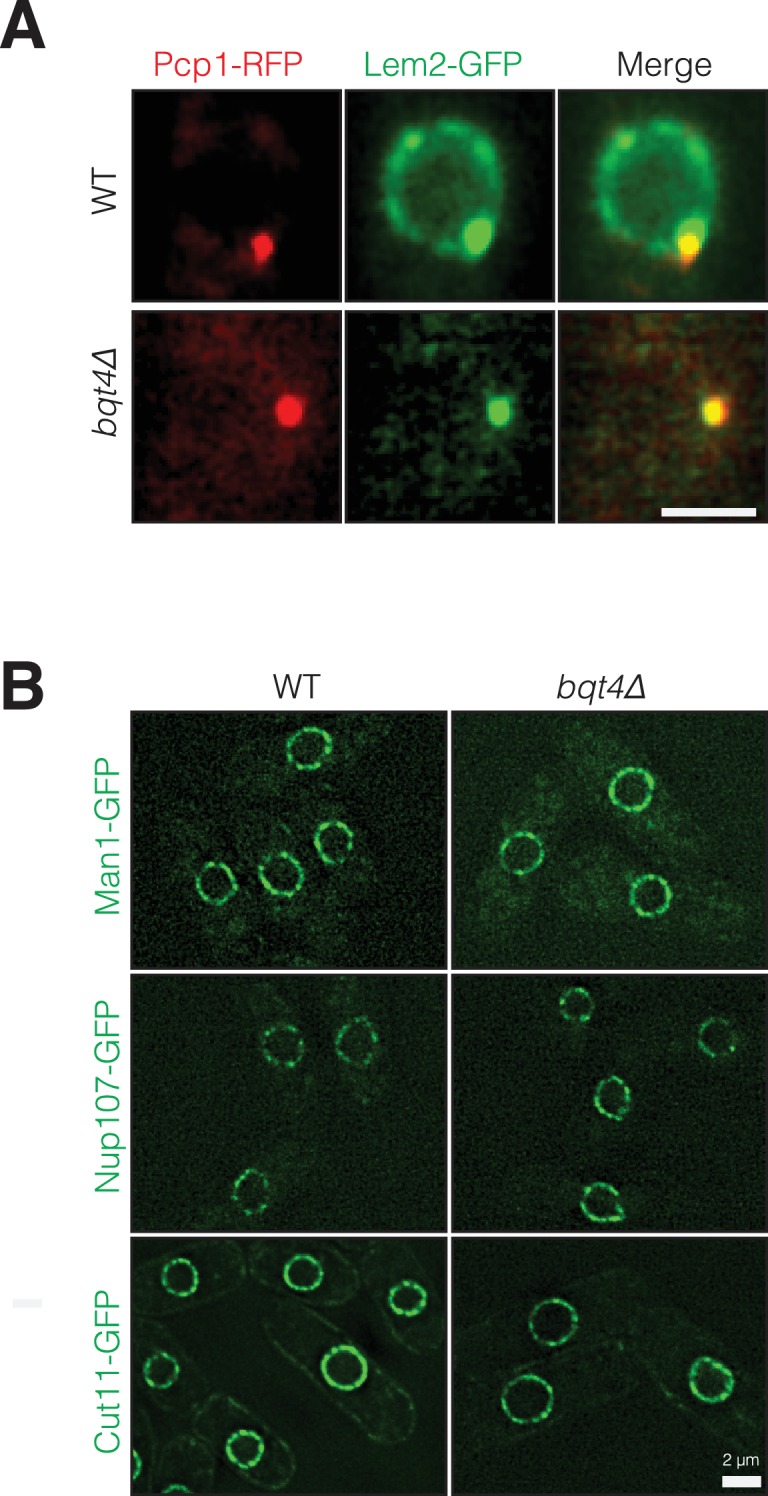
(A) Representative super-resolution microscopy (structured illumination, SIM) image of a live cell harboring Bqt4-GFP. Lateral resolution is 120–150 nm. Arrows indicate regions with relatively low abundance of detectable fluorophore. Scale bars represent 2 µm in all images. (B) SIM images of representative fixed cells expressing Man1-GFP and Bqt4-mCherry, and (C) Lem2-GFP and Bqt4-mCherry. Colocalization quantitations and procedures are described in Figure 1—figure supplement 1A. (D) DeltaVision deconvolution fluorescence imaging of live cells harboring Lem2-GFP and Man1-tdTomato. Quantitation is shown in Figure 1—figure supplement 1C. (E) A representative single z-plane image of a live wt cell expressing Lem2-GFP and histone H3-mCherry. Lem2-GFP is detectable around the NE with an intense dot beneath the SPB. (F) In the absence of Bqt4, Lem2 fails to encircle the NE but remains beneath the SPB. Lateral resolution for (E–F) ~300 nm.

Figure 1—figure supplement 1. Quantitation of NE protein colocalizations.

Figure 1—figure supplement 2. Bqt4 controls localization of Lem2 but not Man1, Nup107 or Cut11.