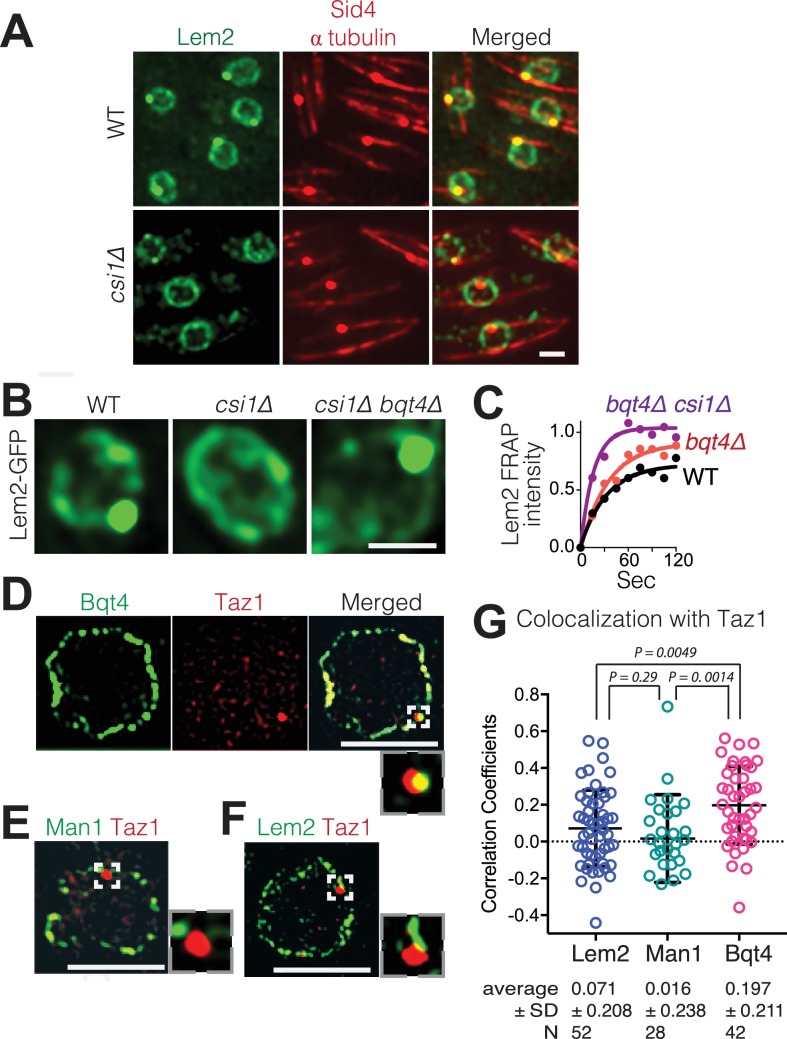
Figure 3. Csi1 stabilizes Lem2 beneath the SPB while Bqt4 moves Lem2 around the NE.
(A) High-resolution images (~300 nm lateral resolution) show that Lem2 localization beneath the SPB requires Csi1. Lem2-GFP and Sid4-mRFP overlap in all WT cells, but fail to overlap in 85% of csi1Δ cells. Scale bars represent two microns in all images. (B) Deletion of bqt4+ restores detectable Lem2-GFP dot at the SPB in csi1Δ cells. (C) FRAP of the visible Lem2-GFP dot as described in Figure 2C. Non-linear fit of the fluorescence recoveries for the indicated strains show curtailed half-life for Lem2-GFP at the SPB in the bqt4Δ csi1Δ double deletion strains. Half-lives: WT 23.11 s, n = 12; bqt4Δ half-life 23.99 s, n = 10; bqt4Δ csi1Δ half-life 11.24 s, n = 18. Mobile fraction (plateau) for WT: 72%, bqt4∆: 91%, bqt4∆csi1∆: 100%. Goodness of fit (R2) for WT: 0.961, bqt4∆: 0.974, bqt4∆csi1∆: 0.956. FRAP could not be performed in the csi1Δ background due to lack of visible Lem2 at the SPB. (D) SIM (120–150 nm lateral resolution) images of representative fixed cells expressing Bqt4-GFP and Taz1-mCherry, (E) Man1-GFP and Taz1-mCherry, and (F) Lem2-GFP and Taz1-mCherry. Insets show magnifications of boxed regions. (G) Co-localization between Taz1 and the indicated proteins was quantified as Pearson correlation coefficients, using the Applied Biosystems softWorX software.
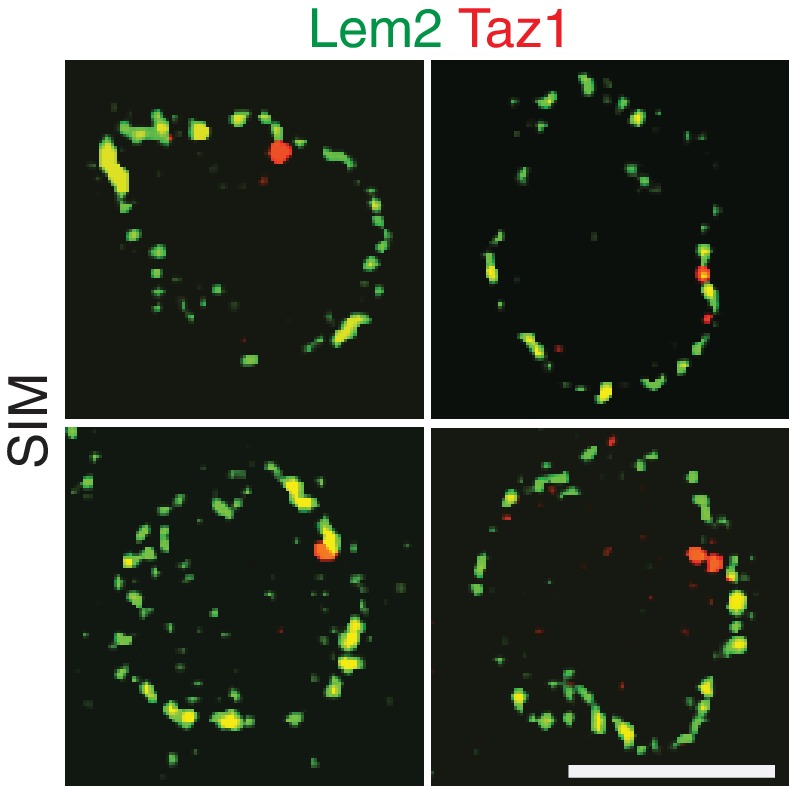
Figure 3—figure supplement 1. Additional examples of simultaneous imaging of Lem2-GFP and Taz1-mCherry by SIM microscopy.


