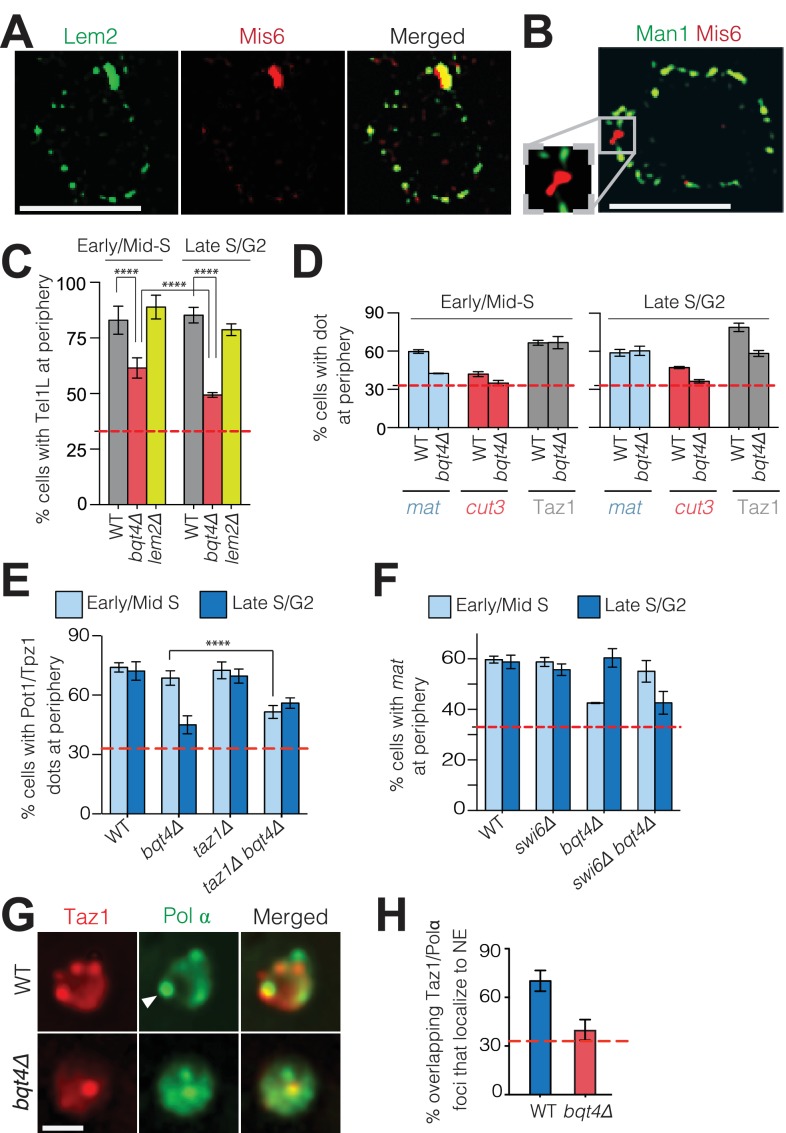
Figure 4. Bqt4 tethers telomeres and the mat locus when undergoing DNA replication.
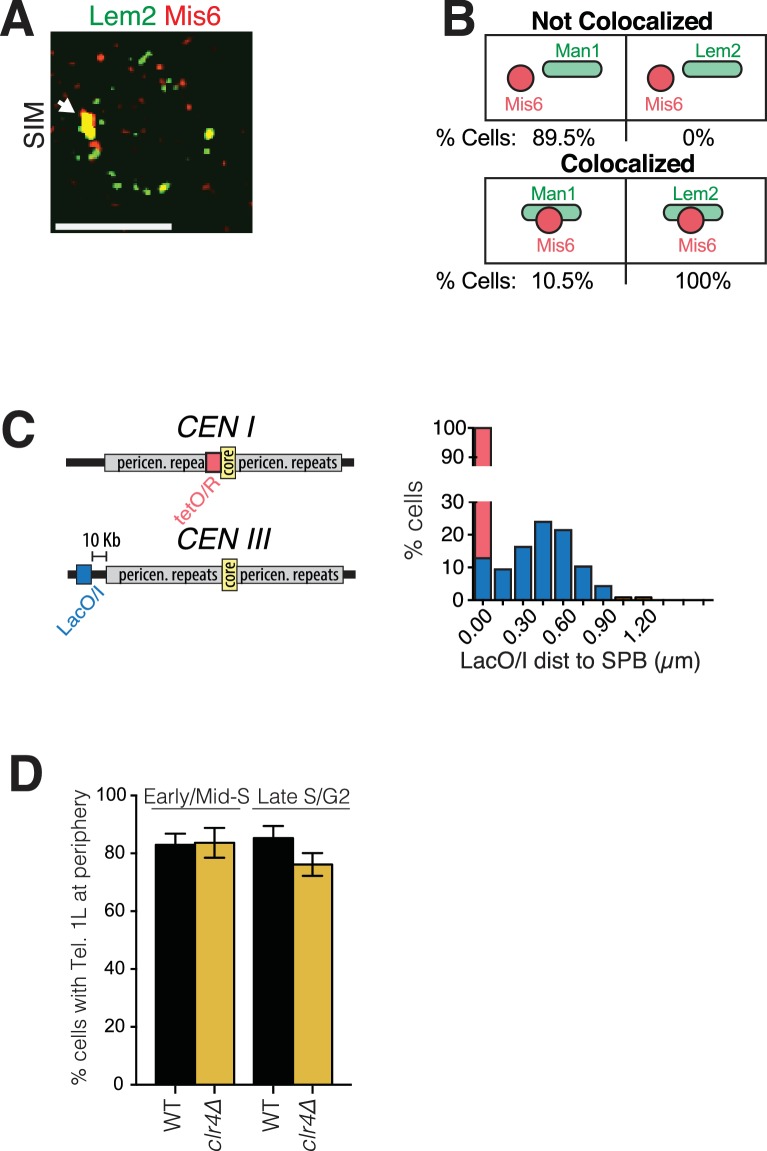
(A) SIM images of representative fixed cells expressing Lem2-GFP and Mis6-mCherry, and (B) Man1-GFP and Mis6-mCherry. Inset in (B) shows magnification of the boxed region. (C) Bqt4 regulates telomere positioning while Lem2 does not. Snapshots of live cells harboring Tel1L-lacO/I-GFP and Cut3-mCherry (to mark the NE) were captured, the distance between the telomere and NE measured, and distances categorized based on the nuclear zoning assay (see Materials and methods) in which the outer third of the nuclear volume is considered the periphery. Dashed red line indicates the level of peripheral zoning expected for random localization within the nucleus (33%). The Y-axis indicates percent of imaged cells in which telomere-NE distance is categorized as Zone I (the most peripheral zone with a maximum distance of ~0.22 µm from the NE). Table 1 shows statistics for the data here and in (D–F). Error bars indicate SD. **** indicates p≤0.0001 as determined by a Student’s t-test. (D) Imaging, quantitation and plotting as in C. The mat locus and cut3 gene were visualized via lacO/I arrays inserted <40 kb away; telomere clusters were visualized via Taz1-mCherry. (E–F) Imaging and quantitation as described in A (n > 80). (G) Colocalization of Taz1-mCherry and Pol α-GFP in the indicated strains was assessed using automated image-analysis on 800–1000 cells, utilizing a MATLAB script that uses a constant threshold level for detecting dots and assigning colocalization, and measures distance to the edge of the nucleus. Arrowhead indicates a site of Polα/telomere colocalization. (H) Data from G were plotted as described in C.


