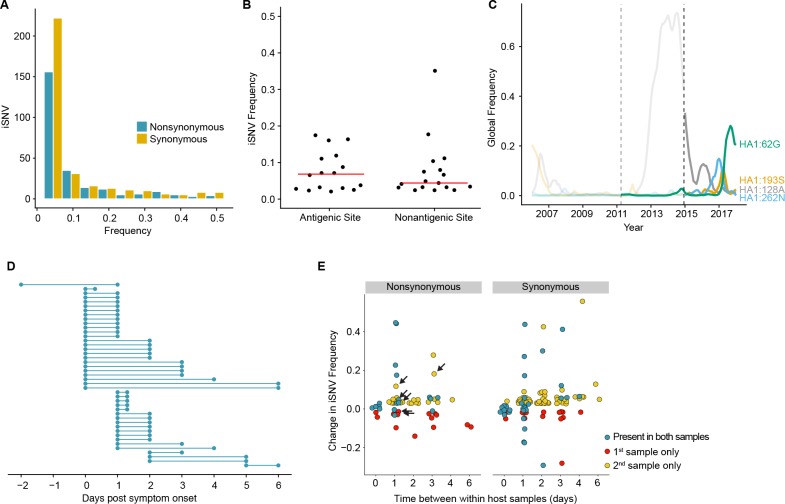
Figure 2. Within-host dynamics of IAV.
(A) Histogram of within-host iSNV frequency in 249 high quality samples. Bin width is 0.05 beginning at 0.02. As in Figure 1, mutations were classified as nonsynonymous (blue) if they were nonsynonymous in any known influenza reading frame. Synonymous mutations are gold. (B) The within-host frequency of nonsynonymous mutations in HA stratified by whether or not they are in known antigenic sites (p=0.46 Wilcoxon rank sum). (C) The global frequency of putative antigenic minority iSNV identified in our cohort that have circulated at frequencies above 5% globally since their time of collection. Each variant is labeled according the H3 numbering scheme. The dashed line indicates when samples were collected. Frequency traces are faded prior to the collection date. (D) Timing of sample collection for 43 paired longitudinal samples relative to day of symptom onset. Of the 49 total, 43 pairs had minority iSNV present in either sample. (E) The change in frequency over time for minority iSNV identified for the paired samples in (A). Nonsynonymous and synonymous iSNV are plotted separately. Mutations are colored according to whether they were detected in both isolates (blue), detected only the first isolate (red), or detected only in the second isolate (yellow). The threshold of detection was 2%. The arrows indicate mutations in known antigenic sites.


