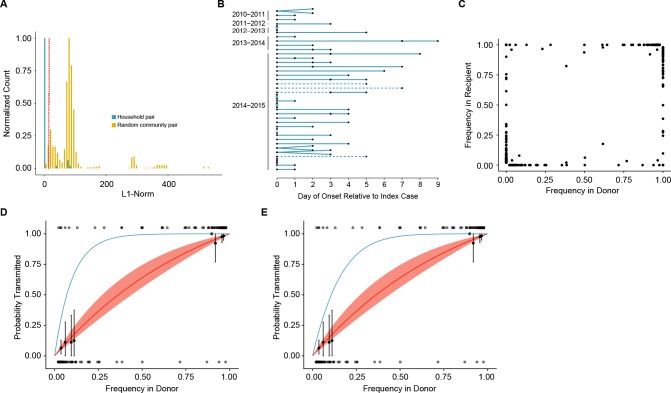
Figure 3. Between host dynamics of IAV.
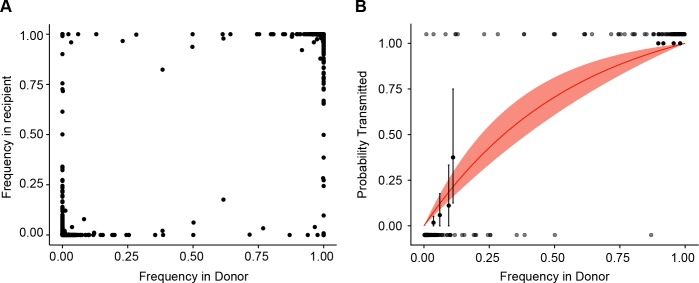
(A) The distribution of pairwise L1-norm distances for household (blue) and randomly-assigned community (gold) pairs. The bar heights are normalized to the height of the highest bar for each given subset (47 for household, 1592 for community). The red line represents the 5th percentile of the community distribution. (B) Timing of symptom onset for 52 epidemiologically linked transmission pairs. Days of symptom onset for both donor and recipient individuals are indicated by black dots. Dashed lines represent pairs that were removed due to abnormally high genetic distance between isolates, see (A). (C) The frequency of donor iSNV in both donor and recipient samples. Frequencies below 2% and above 98% were set to 0% and 100% respectively. (D) The presence-absence model fit compared with the observed data. The x-axis represents the frequency of donor iSNV with transmitted iSNV plotted along the top and nontransmitted iSNV plotted along the bottom. The line represents the predicted probability of transmission given by the presence-absence model with a mean bottleneck of 1.68. The shaded regions represent the 95% confidence interval. Black points on the plot represent the probability of transmission estimated as the proportion of iSNV transmitted within a sliding window of width 5% and a step of 1%. The error bars represent the 95% confidence interval and were derived from a binomial distribution as in (Sobel Leonard et al., 2017). Only those windows with more than 5 iSNV are plotted. Blue curve shows the probability of transmission at a given frequency given a bottleneck size of 10 in the presence-absence model. (E) The beta-binomial model fit. Similar to (D), except the predicted outcomes are the based on a beta-binomial model using a mean bottleneck of 1.75. Blue curve shows the probability of transmission at a given frequency given a bottleneck size of 10 in the beta-binomial model.


