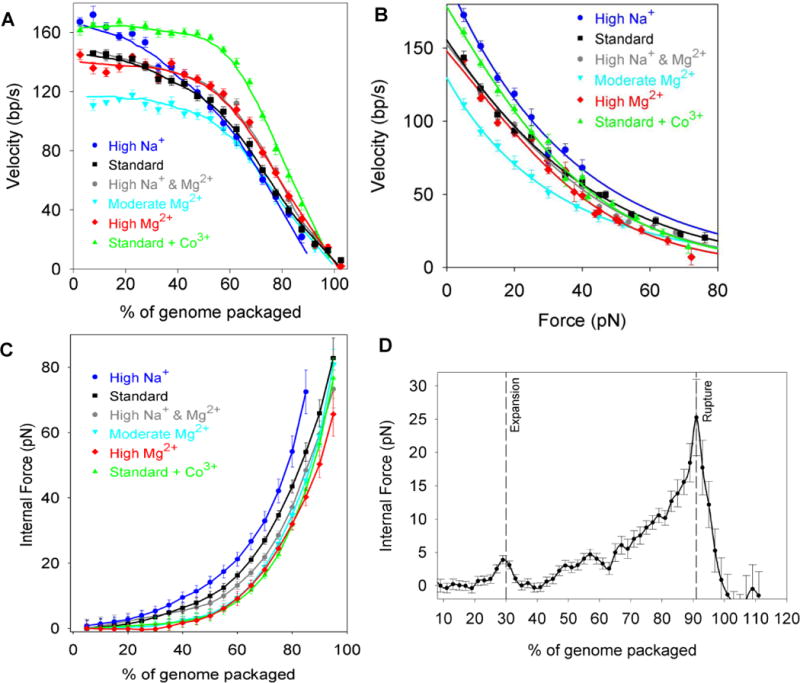
Figure 8.

Motor velocity and internal forces resisting DNA packaging. A) φ29 motor velocity vs. % of genome packaged (measured with 5 pN force feedback) in various ionic conditions (see legend). B) φ29 motor velocity vs. applied load force (measured at low capsid filling with no feedback). C) φ29 internal force vs. % of genome packaged deduced from the measurements in panels A&B. D) Internal force vs. % of genome packaged measured for phage λ in the absence of gpD (a putative capsid stabilizing protein). Proposed capsid expansion and capsid rupture events are marked by the dashed vertical lines.
