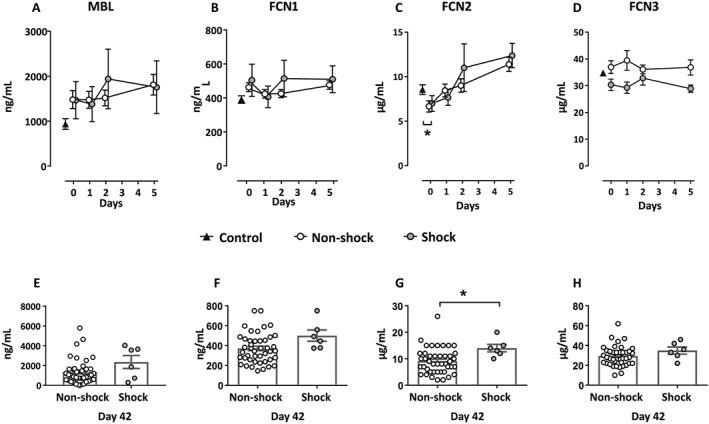
Figure 2.

Lectin pathway proteins levels during the first 5 days of the disease and at Day 42. Figures at the upper panel (A–D) show plasma levels for the (A) mannose‐binding lectin (MBL), (B) Ficolin‐1 (FCN1), (C) Ficolin‐2 (FCN2), and (D) Ficolin‐3 (FCN3) for patients from inclusion (Day 0) to Day 5 (the acute phase of the disease). Figures in the lower panel (E–H) show plasma levels for the (E) MBL, (F) FCN1, (G) FCN2, and (H) FCN3 at Day 42. The figures are shown with the same patient populations and details as described in the Figure 1 legend. *P < 0.05.
