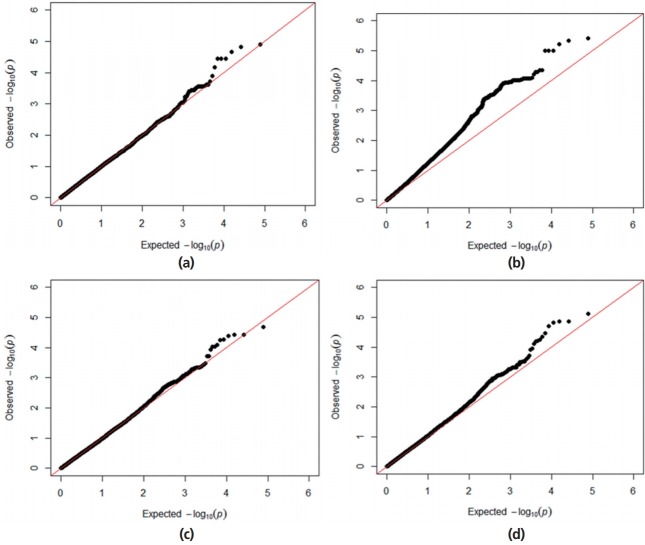
Figure 1.
Quantile-quantile plots for average daily gain (ADG) using the mixed-model association methods with different genomic inflation factor (lambda) in a Landrace nucleus herd. (a) Quantile-quantile plot with lambda of 1.02 for individual average daily gain (iADG) with candidate marker included mixed linear model (MLMi). (b) Quantile-quantile plot with lambda 0f 1.28 for iADG with candidate marker excluded mixed linear model (MLMe). (c) Quantile-quantile plot with lambda of 1.00 for social average daily gain (sADG) with candidate marker MLMi. (d) Quantile-quantile plot with lambda of 1.07 for sADG with candidate marker MLMe.

