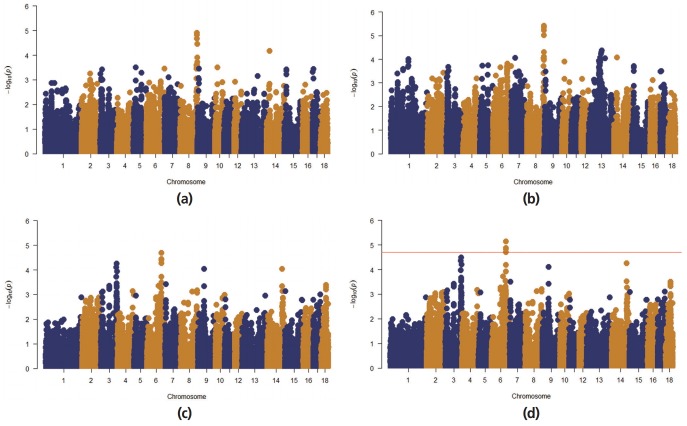
Figure 3.
Manhattan plots for average daily gain (ADG) using the mixed-model association methods in a Landrace nucleus herd. The horizontal red line indicates the significance thresholds (false discovery rate ≤0.20). (a) Manhattan plot for individual average daily gain (iADG) with candidate marker included mixed linear model (MLMi). (b) Manhattan plot for iADG with candidate marker excluded mixed linear model (MLMe). (c) Manhattan plot for social average daily gain (sADG) with candidate marker MLMi. (d) Manhattan plot for sADG with candidate marker MLMe.

