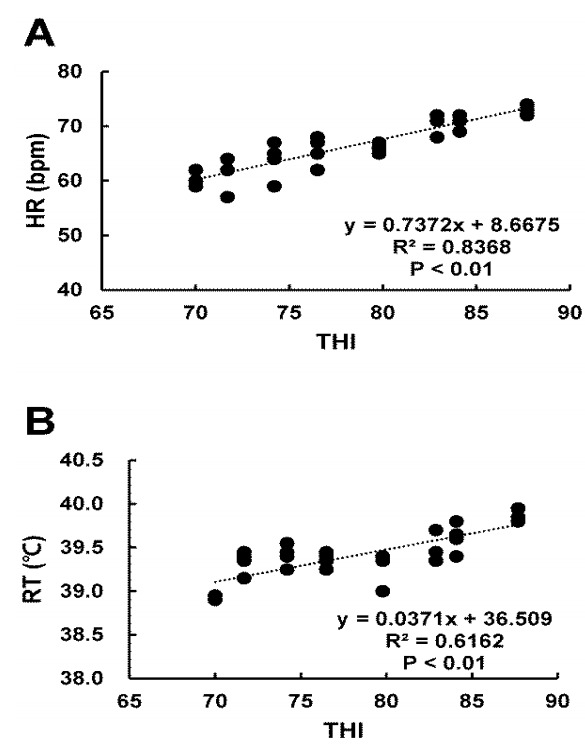
Figure 1.

Relationship between heart rate (HR), rectal temperature (RT), and temperature humidity index (THI) under heat stress. (A) HR and (B) RT were measured on the 2nd day and the last day (1100 h) during the experimental period. HR and RT were increased at high THI compared to those at low THI (R2 = 0.8368, p<0.01; R2 = 0.6162, p<0.01, respectively).
