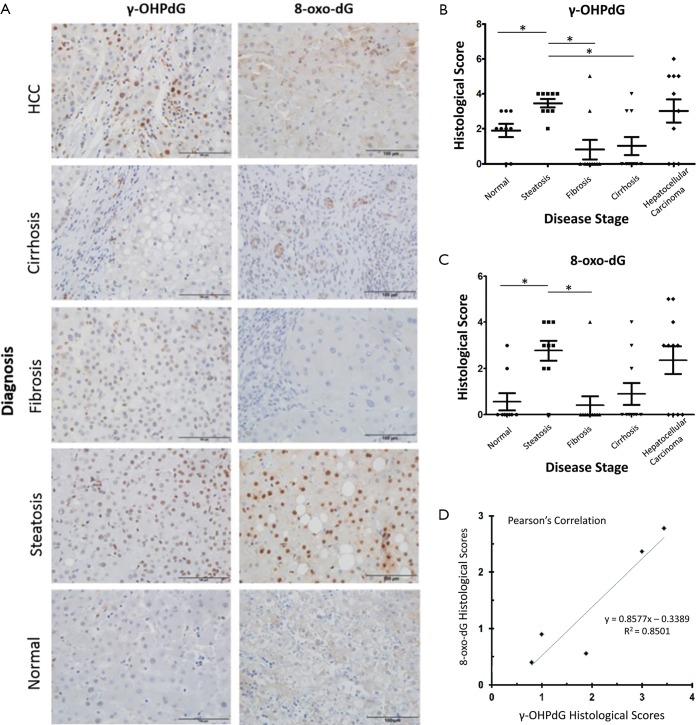
Figure 2.
Detection and scoring of γ-OHPdG and 8-oxo-dG in FFPE human liver tissues in different stages of diagnosis. (A) Representative IHC staining of FFPE human liver tissue sections positive for γ-OHPdG or 8-oxo-dG. Scale bar indicates 100 µm; (B) dot plots of γ-OHPdG and (C) 8-oxo-dG levels based on histological scoring across the disease spectrum, center line indicates mean and whiskers standard error of the mean (SEM). * indicates significance (P≤0.005) between groups using two-sample independent t-tests; (D) histological score quantification across groups with Pearson’s correlation between γ-OHPdG and 8-oxo-dG, Pearson’s R2 =0.85. The symbols (triangle/circular/square/diamond) are for each individual histology score per sample in each group. FFPE, formalin-fixed paraffin embedded; IHC, immunohistochemical.

