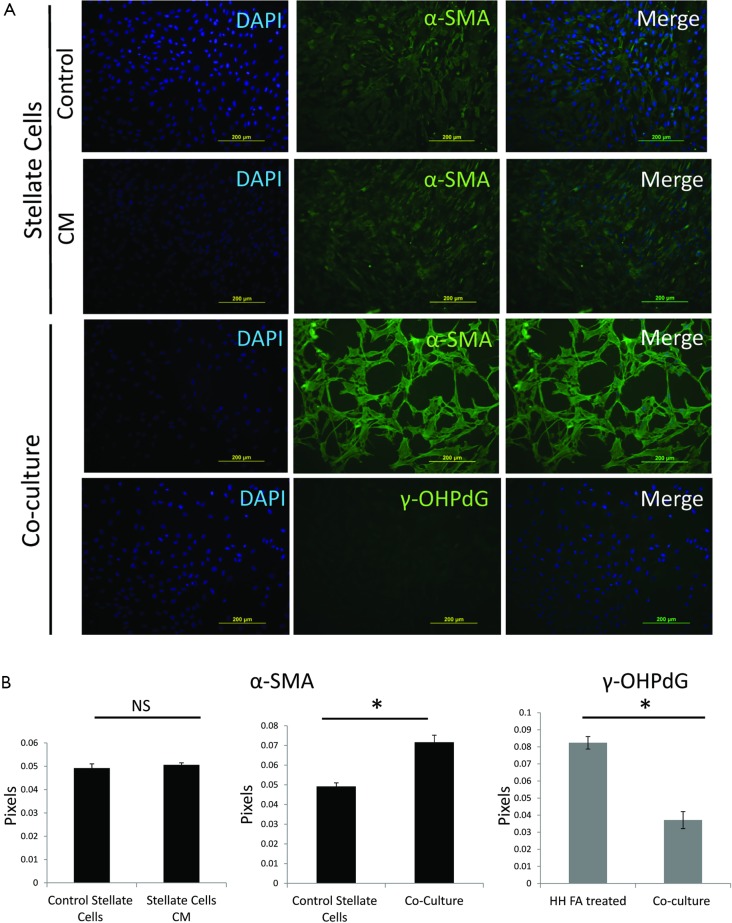
Figure 4.
ICC and intensity quantification of α-SMA and γ-OHPdG in SC and under co-culture conditions. (A) SC untreated and treated with CM for 3 days stained for α-SMA and co-culture for 3 days, stained for α-SMA and γ-OHPdG (20× magnification, scale bar indicates 200 µm); (B) quantification of the staining intensity of α-SMA and γ-OHPdG of the SC and HH before and during co-culture conditions. * indicates significance (P≤0.005) between groups using two-sample independent t-tests. NS indicates not significant. ICC, immunocytochemistry; SC, stellate cell; CM, conditioned media; α-SMA, alpha-smooth muscle actin; HH, human hepatocytes.

