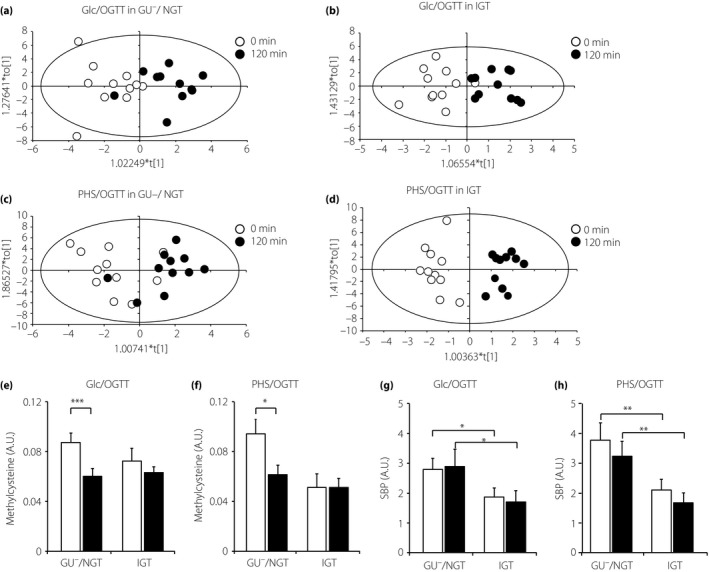
Figure 4.

Changes in serum metabolites before and 120 min after oral glucose tolerance test (OGTT). (a–d) Orthogonal projections to latent structures discriminant analysis scores plots of data of (a) D‐glucose (Glc)/OGTT in glycosuria‐negative/normal glucose tolerance (GU −/NGT; R 2Y = 0.610, Q 2 = 0.354), (b) Glc/OGTT in impaired glucose tolerance (IGT; R 2Y = 0.721, Q 2 = 0.405) and (c) partial hydrolysate of starch (PHS)/OGTT in GU −/NGT (R 2Y = 0.509, Q 2 = 0.098). (d) PHS/OGTT in IGT (R 2Y = 0.909, Q 2 = 0.370). (e–h) Changes in serum methylcysteine and sedoheptulose 1,7‐bisphosphate (SBP) levels before and 120 min after OGTT. (e,f) Changes in serum methylcysteine at 0 (open columns) and 120 min (filled columns) during (e) Glc/OGTT and (f) PHS/OGTT. *P < 0.05, ***P < 0.001. NS, not significant by two‐tailed paired t‐test. (g,h) Changes in serum SBP at 0 (open columns) and 120 min (filled columns) during (g) Glc/OGTT and (h) PHS/OGTT. *P < 0.05, **P < 0.01 by two‐way repeated‐measurement anova with the Bonferroni post‐hoc test. (e–h) n = 11 for all groups. A.U., arbitrary unit.
