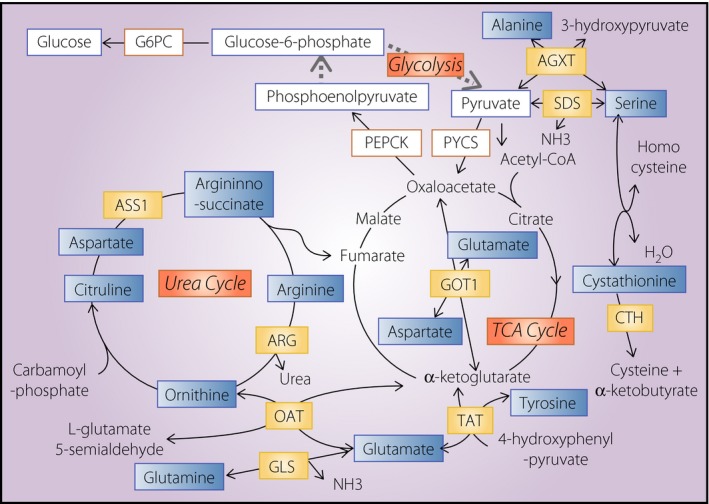
Figure 2.

Schematic representation of the metabolic pathways regulated by glucagon. The enzymes and metabolites involved in glycolysis, gluconeogenesis, the tricarboxylic acid (TCA) cycle and the urea cycle are summarized. The expression levels of genes encoding enzymes in letters with yellow boxes are decreased in the glucagon‐green fluorescent protein knock‐in allele liver, whereas the expression levels of metabolites in letters in blue boxes are increased. Other enzymes and metabolites with boxes were also analyzed; however, no significant differences were observed in their expression between the glucagon‐green fluorescent protein knock‐in allele and control liver. AGXT, alanine‐glyoxylate aminotransferase; ARG, arginase; ASS1, arginosuccinate synthase 1; CTH, cystathionase; G6PC, glucose‐6‐phosphatase catalytic subunit; GLS, glutaminase; GOT1, glutamic‐oxaloacetic transaminase; OAT, ornithine aminotranspherase; PEPCK, phosphoenolpyruvate creatine kinase; PYCS, pyruvate carboxylase; SDS, serine dehydratase; TAT, tyrosine aminotransferase.
