
Figure 3.
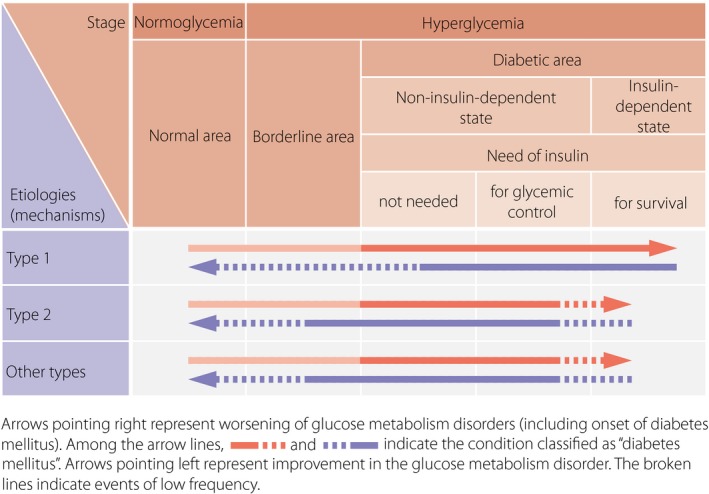
A schematic diagram of the relationship between the etiology (mechanism) and pathophysiological stages (states) of diabetes mellitus. Arrows pointing right represent the worsening of glucose metabolism disorders (including the onset of diabetes mellitus). Among the arrow lines, indicates the condition classified as ‘diabetes mellitus’. Arrows pointing left represent improvement in the glucose metabolism disorder. The broken lines indicate events of low frequency. For example, in type 2 diabetes mellitus, infection can lead to ketoacidosis and require temporary insulin treatment for survival. Also, once diabetes mellitus has developed, it is treated as diabetes mellitus regardless of the improvement in the glucose metabolism; thus, the arrow lines pointing left are filled in black. In such cases, a broken line is used, because complete normalization of the glucose metabolism is rare.