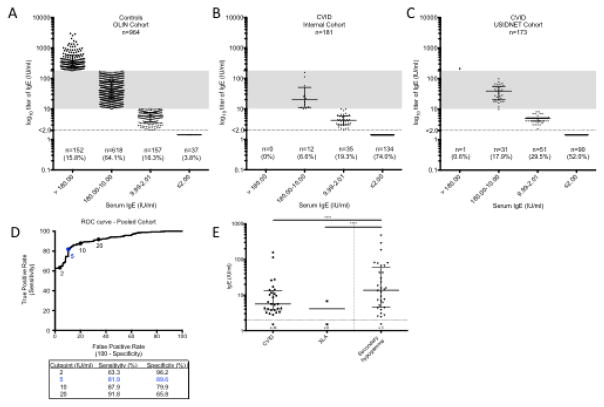
Fig. 1.
Serum IgE in controls and hypogammaglobulinemia. Serum total IgE levels were measured in A) 964 controls from the OLIN population-based cohort in Northern Sweden; B) an internal cohort of 181 patients with CVID; and C) a multi-center USIDNET cohort of 173 patients with CVID. Shaded region represents normal range for IgE based on UVA lab. D) ROC curve characteristics based on pooled internal and USIDNET cohort (n=354). E) Serum IgE levels in patients with primary hypogammaglobulinemia (CVID, n=62 or XLA, n=9) compared to those with secondary hypogammaglobulinemia (n=34). Horizontal line is drawn at median and error bars show interquartile range (IQR). **** p<0.0001 using Kruskal-Wallis test with Dunn’s correction for multiple comparisons

