Figure 3.

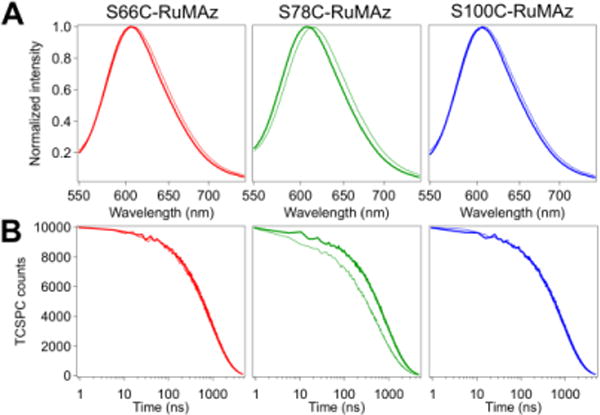
(A) Normalized emission spectra and (B) TCSPC decay traces of RuZnAz (thin lines) and RuZnAz-[1] (thick lines) as labeled on figure. Samples contain 5 μM protein in 750 mM phosphate/12.5 mM CHES buffer, pH 7.25, under a CO2 atmosphere.

(A) Normalized emission spectra and (B) TCSPC decay traces of RuZnAz (thin lines) and RuZnAz-[1] (thick lines) as labeled on figure. Samples contain 5 μM protein in 750 mM phosphate/12.5 mM CHES buffer, pH 7.25, under a CO2 atmosphere.