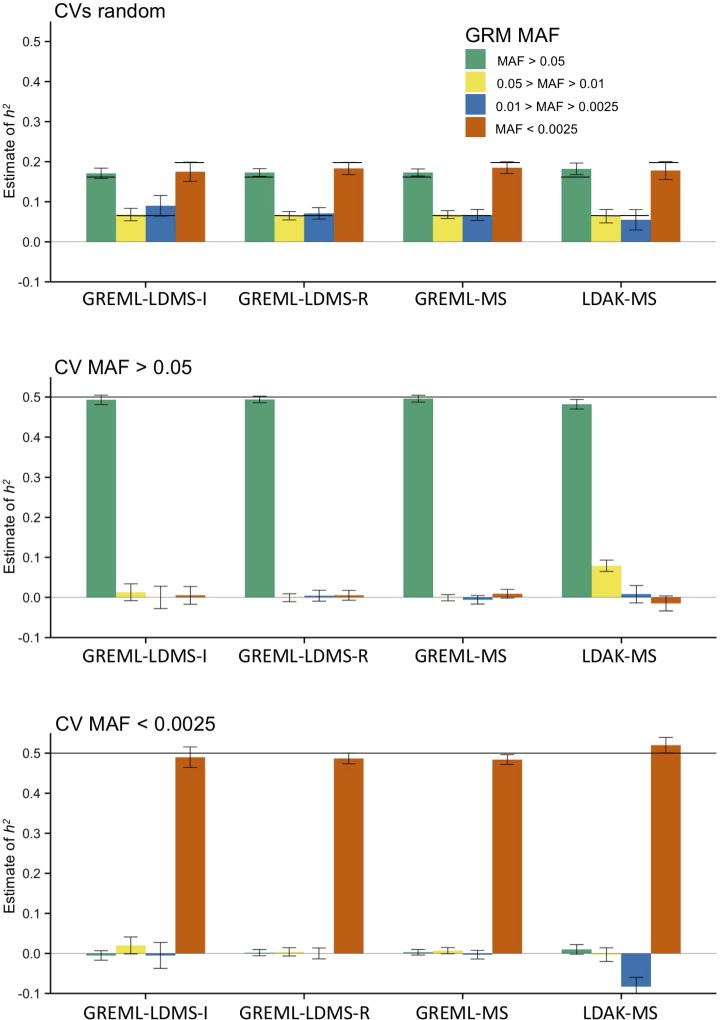
Figure 2.
Mean for four MAF bins across 100 replicates from multi-component approaches in unrelated individuals using WGS SNPs in the least structured subsample. See Fig. 1 for specific methods. Black lines are the true (simulated) h2 values; note that in the top panel, the true h2 values differ across MAF. See Online Methods for descriptions of each method and Supplementary Figures for additional estimates and Supplementary Table 4 for numerical results. Error bars represent 95% confidence intervals.

