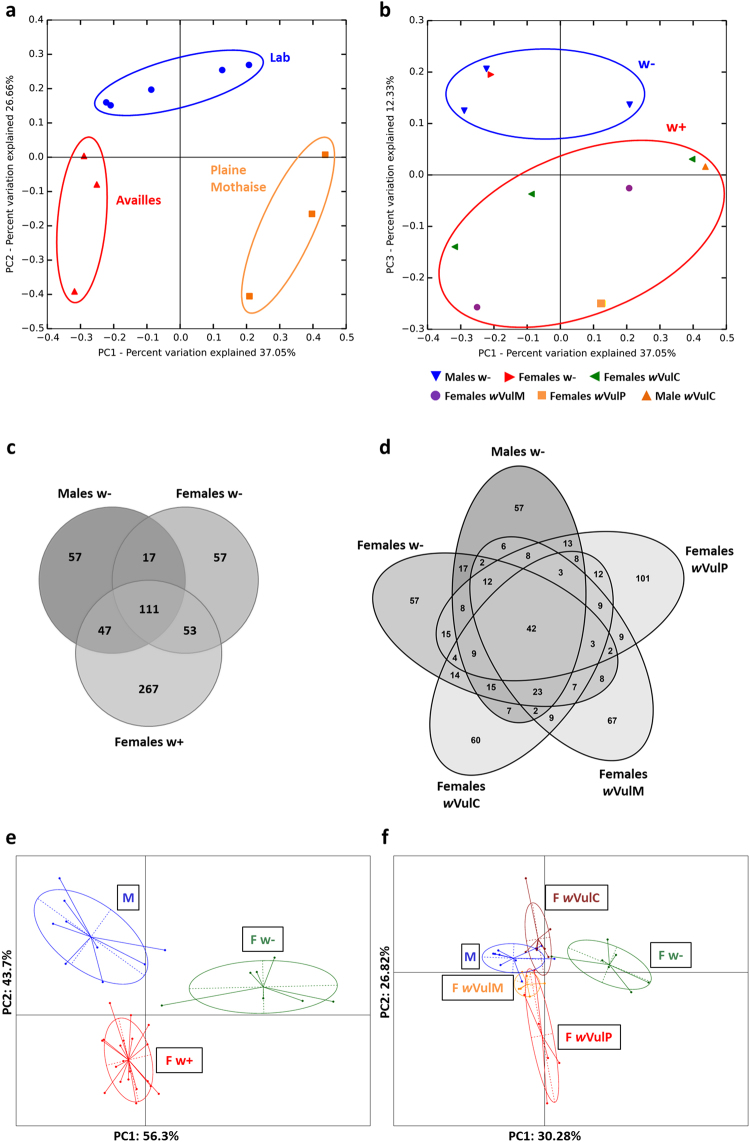
Figure 3.
Impact of Wolbachia infection on microbiota composition. (a,b) PCoA based on Bray-Curtis distances showing the impact of host origin (a) and Wolbachia infection (b) on microbiota composition. Each data point represents the microbiota of a given sample type after merging the sequencing data from five different tissues. (c,d) Distribution of OTUs in isopods from laboratory lineages depending on Wolbachia infection (c) and infection with different Wolbachia strains (d). (e,f) Between-Class-Analysis of TGGE profiles showing differences in microbiota composition depending on Wolbachia infection (e) and infection with different Wolbachia strains (f) for specimens from laboratory lineages. Each data point represents the merged profile from five different tissues of an individual isopod.

