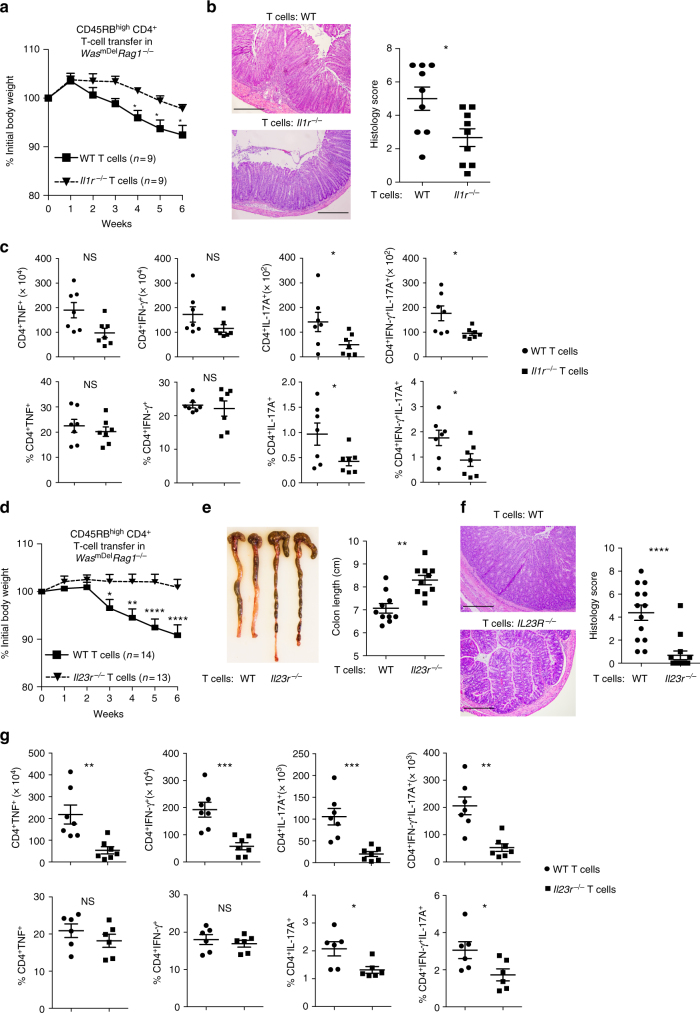
Fig. 3.
Role of IL-1 and IL-23 signalling in T cells in the induction of colitis in WasmDelRag1−/− mice. Naive CD4+CD25−CD45RBhi T cells (3–5 × 10⁵) from WT or Il1r−/− mice were transferred i.p. into WasmDelRag1−/− mice. a Mean ± SEM % initial body weight (mean ± SEM) after transfer. (WT n = 9; Il1r−/− n = 9). *p < 0.05 (two-way ANOVA). Data are cumulative of two independent experiments. b Representative photomicrographs of H&E-stained colonic section and histological score at 6 weeks after transfer. Scale bars: 200 μm. c Absolute number and frequency of TNF+, IFN-γ+, IL-17A+ and IFN-γ+IL-17A+ helper T cells in the LP was determined by flow cytometry (WT n = 7; Il1r−/− n = 7). Data are cumulative of two independent experiments. Naive CD4+CD25−CD45RBhi T cells (3–5 × 10⁵) from WT or Il23r−/− mice were transferred i.p. into WasmDelRag1−/− mice. d Mean ± SEM % initial body weight (mean ± SEM) after transfer. (WT n = 14; Il23r−/− n = 13). *p < 0.05, **p < 0.01, ****p < 0.0001 (two-way ANOVA). Data are cumulative of three independent experiments. e Colon length at 6 weeks post transfer. (WT n = 10; Il23r−/− n = 10). f Representative photomicrographs of H&E-stained colonic section and histological score at six weeks after transfer. Scale bars: 200 μm. g Absolute number and frequency of cytokine producing helper T cells in the LP was determined by flow cytometry (WT n = 7; Il23r−/− n = 7). Data are cumulative of two independent experiments. Data shown in b,c and e–g are mean ± SEM and P-value was obtained by Student’s t-test. *p < 0.05, **p < 0.01, ***p < 0.001, ****p < 0.0001

