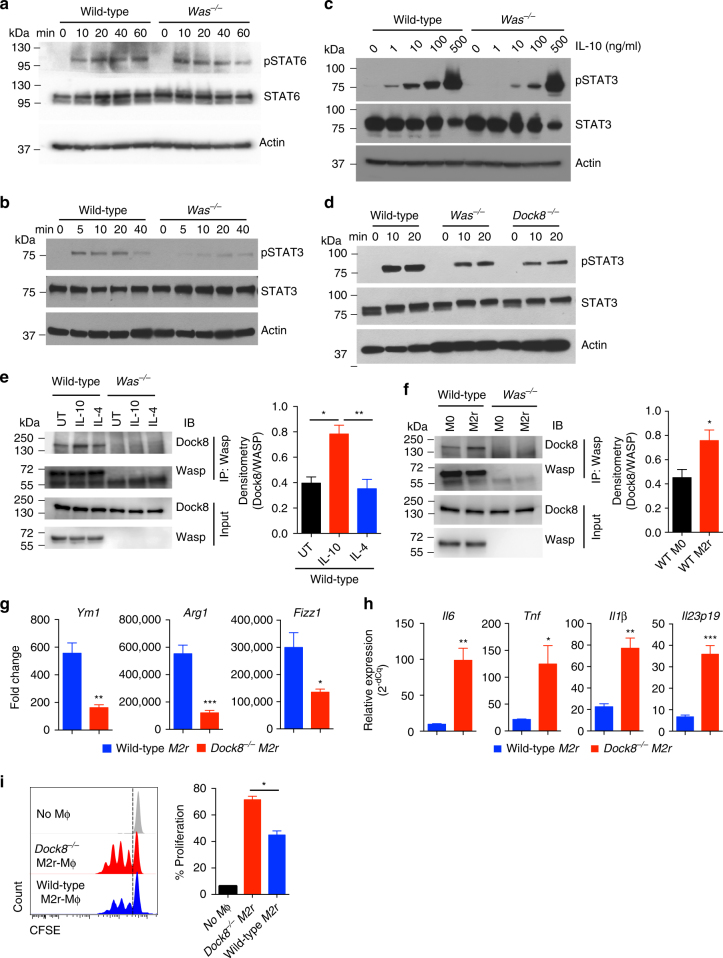
Fig. 6.
STAT3 phosphorylation downstream of IL-10R signalling involves WASP-DOCK8 complex. WT and Was−/− BMDM were treated with IL-4 (20ng/ml) a or IL-10 (20ng/ml) b for the indicated time and pSTAT6 or pSTAT3 was analysed by western blotting, respectively. Data are representative of three independent experiments. c WT and Was−/− BMDM were treated with various concentration of IL-10 for 20 min and pSTAT3 was analysed by western blotting. Data are representative of three independent experiments. d WT, Was−/− and Dock8−/− BMDMs were treated with IL-10 for the indicated time and pSTAT3 was analysed by western blotting. Data are representative of three independent experiments. e BMDM were treated with IL-10 (20ng/ml) or IL-4 (20ng/ml) for 30 min. Cell extracts were immunoprecipitated (IP) with anti-WASP antibody and interaction with DOCK8 is detected with immunoblotting (IB). Data are representative of three independent experiments with similar results and the histogram shows the cumulative densitometry. f Cell extracts from M0 and M2r macrophages were immunoprecipitated with anti-WASP antibody and interaction with DOCK8 is detected with immunoblotting. Data are representative of three independent experiments with similar results and the histogram shows the cumulative densitometry. BMDM from WT and Dock8−/− mice were cultured in the presence of IL-4, IL-10 and TGF-β for 24 h to differentiate them into M2r macrophages. g qPCR analysis of M2-specific genes in WT (n = 5) and Dock8−/− (n = 5) M2r-BMDM. h Expression of proinflammatory genes by WT (n = 5) and Dock8−/− (n = 5) M2r-BMDM after restimulation with LPS for 4 h was determined by qPCR. Data are representative of three independent experiments g,h. i CFSE-labelled naive CD4+CD25– T cells were cultured in the presence of plate bound anti-CD3 (2μg/ml) and either WT or Dock8−/− M2r macrophages for 4 days. T-cell proliferation was determined by flow cytometer. Data are representative of three independent experiments. Data shown in e–i are mean ± SEM and P-value was obtained by Student’s t-test. *p < 0.05, **p < 0.01, ***p < 0.001

