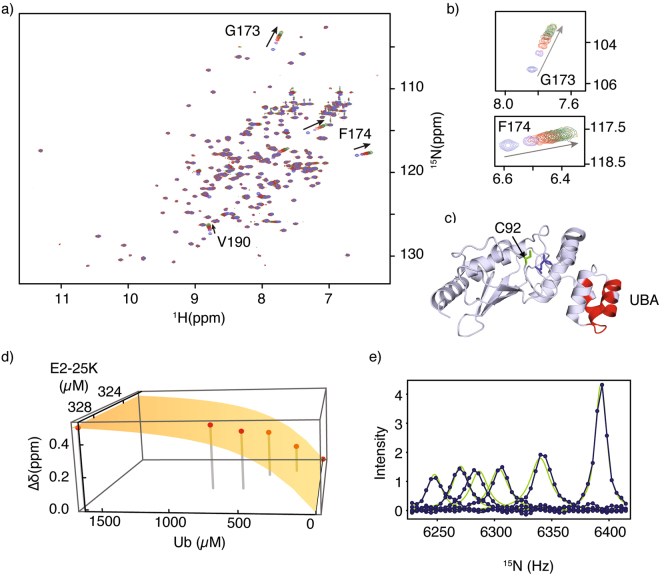
Figure 4.
(a) Superposition of E2-25K 1H-15N HSQC NMR spectra upon titration with Ub, arrows indicate chemical shift changes with increasing Ub concentration. (b) Expansion of the spectra around G173/F174, residues experiencing significant chemical shift changes upon interaction with Ub, arrows indicate increasing Ub concentration. (c) Significant chemical shift perturbations (>Δδ + 1σ, red) upon Ub binding, mapped onto the main chain structure of E2-25K. The active site C92 (green) and gate residue Q126 (blue) are shown in the stick representation. (d) Chemical shift changes for G173 upon titration with Ub fit to a 1:1 binding isotherm, experimental shifts are shown as points, and the best fit as a surface. (e) 15N lineshape analysis for residue G173 with experimental data shown as points (blue), and the best fits shown as green lines.

