Figure 1.
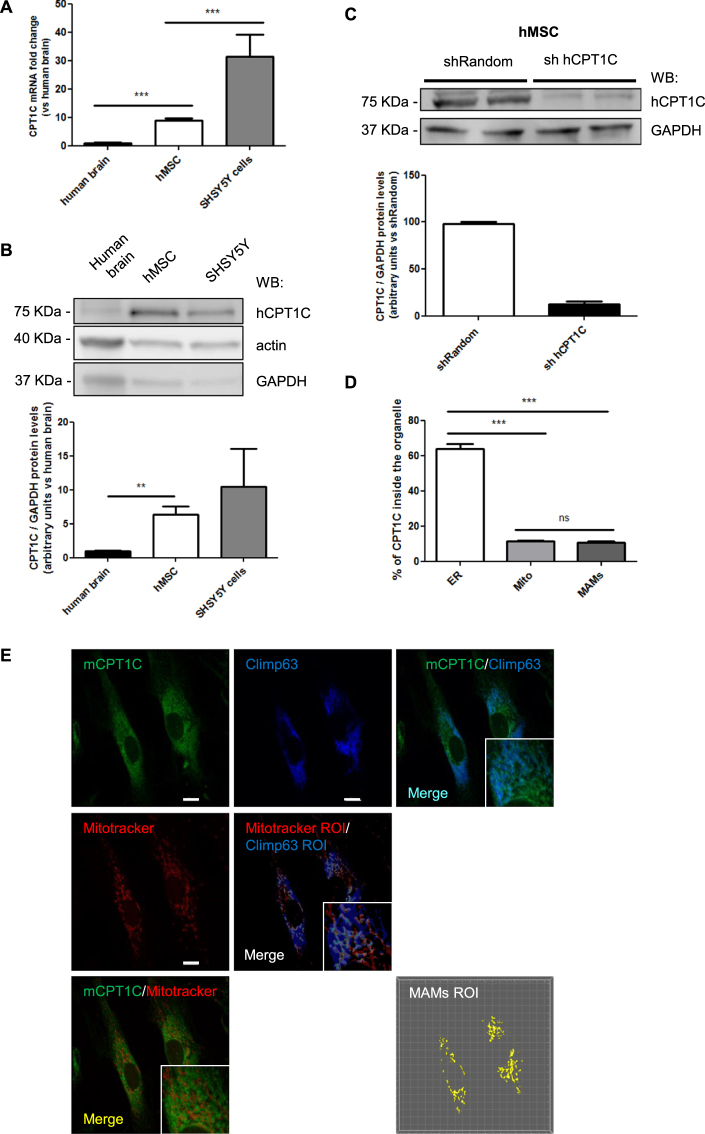
CPT1C is expressed in adult hMSCs. (A) CPT1C mRNA levels were determined by real-time PCR in human brain, hMSCs and SH-SY5H cell line. Actin was used as a housekeeping gene. Results are shown as mean ± SEM of sextuplet. (B) Endogenous CPT1C was analyzed by Western Blot in hMSCs, human brain cells, and the SH-SY5Y human neuroblastoma cell line. GAPDH was used as a loading control. n = 3–6. (C) hMSCs were infected with a lentivirus expressing a random sequence (Random) or a silencing sequence for human CPT1C (sh hCPT1C). Transduced cells were selected by FACS. Expression of CPT1C analyzed by Western blot showed an 80% of reduction in silenced cells (sh hCPT1C). GAPDH was used as a loading control. Graph shows the mean ± SEM of 3 independent experiments performed in duplicate. (D,E) hMSCs were infected with a lentivirus to drive the expression of mouse CPT1C (pWPI-mCPT1C-IRES-GFP). Mitotracker Orange was used to stain mitochondria, while mCPT1C and Climp63, the latter used as an ER marker, were detected by immunocytochemistry. EV-hMSCs were used as a negative control for CPT1C immunocytochemistry (see the images in Supplemental Fig. 2).The graph shows the percentage of CPT1C inside the ER, in the mitochondria, or on the surface (region of interest, ROI) defined by the colocalization of the ER with the mitochondria (MAMs). Values shown in D are expressed as mean ± SEM of 3 independent experiments performed in duplicate (10 randomly selected cells per coverslips were analyzed). Scale bar 10 µm. *p < 0.05; ***p < 0.001.

