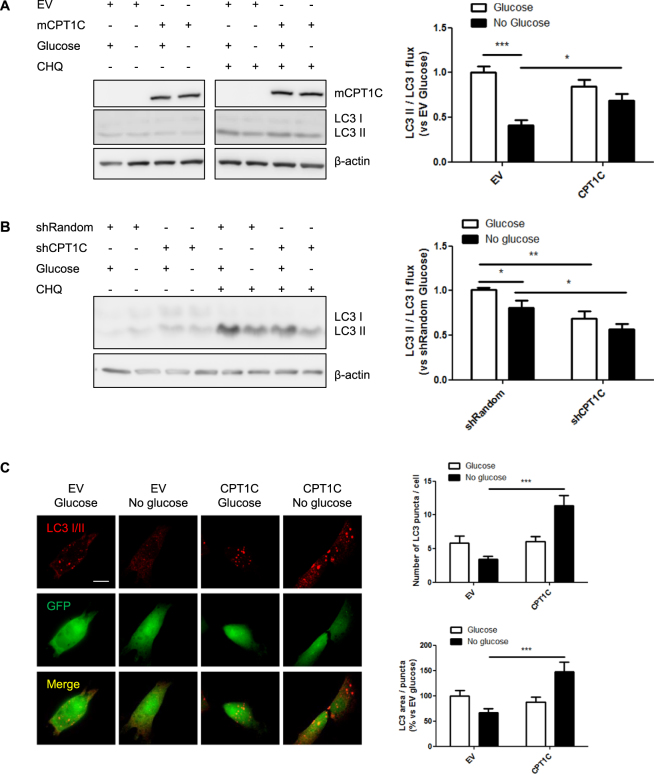
Figure 4.
CPT1C overexpression promotes autophagy under glucose-depleted conditions. (A,B) Quantification of the LC3II/LC3I flux in EV and CPT1C-hMSCs (A) or shRandom and shCPT1C-hMSCs (B) in the presence or the absence (24 h) of glucose. In some of the wells, 50 µM chloroquine was added 1 h before cell recollection. LC3 I and LC3 II were analyzed by Western Blot. GFP was used as a transduction control and β-actin as a loading control. Blots displayed in A were cropped from different parts of the same gel (see full-length blot in Supplemental Fig. 6A). Results are shown as mean ± SEM of 3 independent experiments performed in duplicate. (C) LC3 was detected by immunocytochemistry in EV- or CPT1C-hMSCs 24 h after glucose depletion. Twenty randomly selected cells per condition were analyzed in 5 independent experiments performed in duplicate. The graphs show the number of LC3 puncta per cell (above) and the LC3 area per puncta (down) and are expressed as mean ± SEM. Scale bar 20 µm. *p < 0.05; ***p < 0.001.

