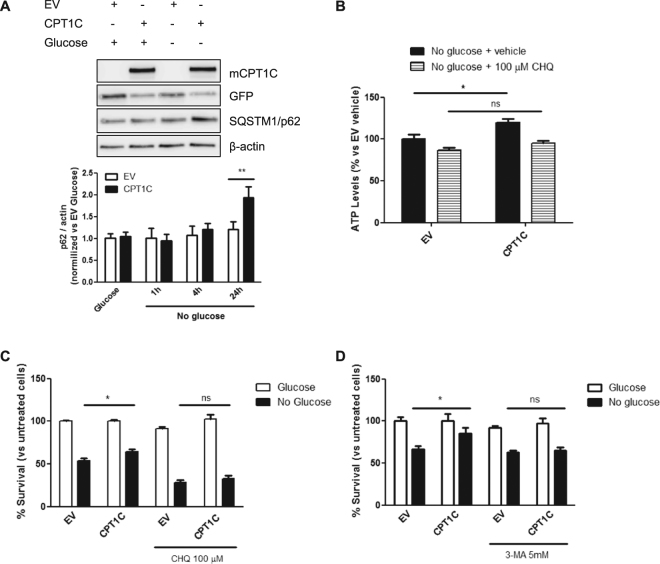
Figure 5.
Autophagy inhibition blocks CPT1C protective effects against glucose starvation. (A) p62 protein levels were analyzed by immunoblotting in EV or CPT1C-hMSCs at the indicated times after glucose depletion. (B) ATP production was evaluated after 36 h of glucose starvation in the presence (last 24 h) or absence of 100 µM chloroquine. Results are shown as mean ± SEM of 2 independent experiments performed in triplicate. (C,D) Cellular viability was measured in EV or CPT1C-hMSCs in the presence or absence of glucose for 72 h with or without the addition of chloroquine (in C) or 3-MA (in D) in the last 24 h. Results are shown as mean ± SEM of 3 or 4 independent experiments performed in sextuplet. *p < 0.05.

