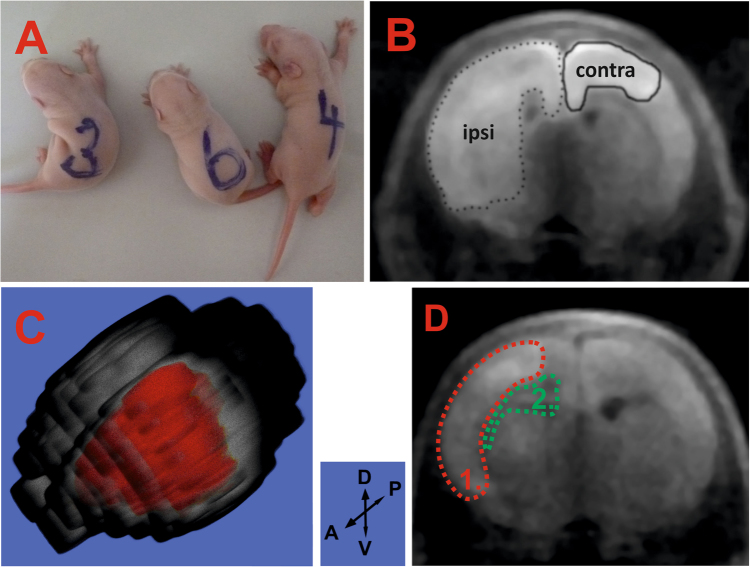
Figure 1.
Effects during the acute and subacute stages of HI insult. (A) – insulted pups curved to the left (#3 and 4), while the sham pups did not (#6). (B) – cytotoxic oedema development in the ipsilateral hemisphere (dotted line) and contralateral hemisphere (bold line) was detected immediately after HI insult at the striatal level (pup #16). (C) – 3D image of the brain depicting the extent of the lesion (in red) in the ipsilateral hemisphere (pup #7); D-V and A-P black arrows indicate the dorso-ventral and anterior-posterior directions, respectively. (D) – subacute stage: areas of simultaneously occurring vasogenic and cytotoxic oedema are shown in green and red, respectively (pup #9).

