Figure 2.
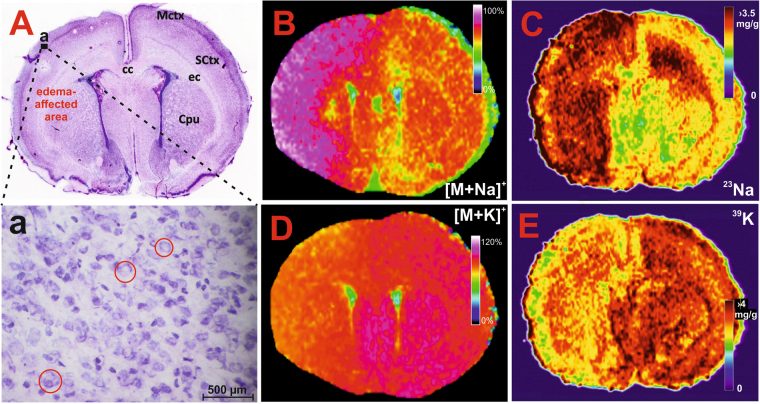
Histological and MSI assessment of the HI-insulted neonatal rat brains during the acute stage of HIE. Panel A: Haematoxylin-eosin stained section demonstrating the early cellular response; a – expanded region of the ipsilateral hemisphere (indicated by the black rectangle shown in (A)) depicting the cytotoxic oedema-afflicted neurons with signs of swelling and vacuolization (red circles). MALDI MS images showing the altered distribution of PC (16:0/16:0) in the sodiated (panel B, m/z 756.550) and potassiated (panel D, m/z 772.525; signal was overscaled to 120% to provide better contrast) form. Quantitative LA-ICP-MS images of the elemental sodium (panel C) and potassium (panel E) distribution (for details see Supplementary Figure S4). MCtx (motor cortex), cc (corpus callosum), SCtx (somatosensory cortex), ec (external capsule), Cpu (caudate putamen = striatum). Different image scaling (B/D versus C/E) are due to different FlexImaging (Bruker Daltonics, Bremen, Germany) and ImageLab42 programs.

