Figure 3.
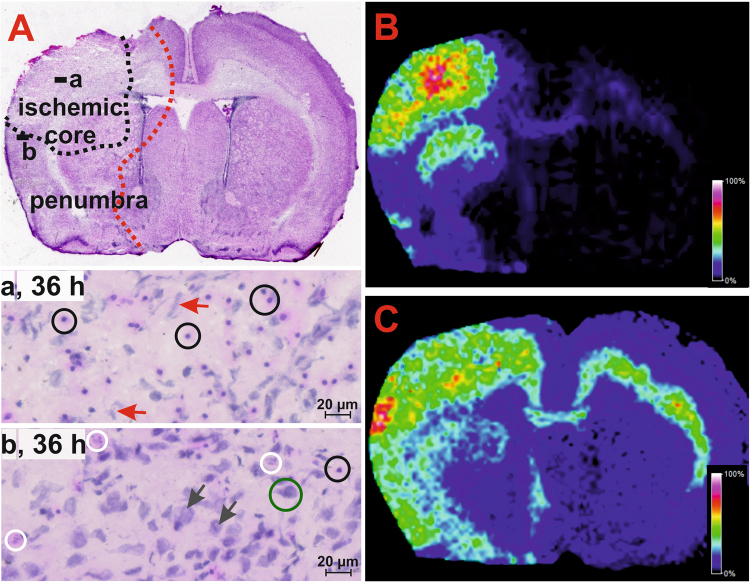
Subacute response to HI insult in the neonatal rat brain. (A) Haematoxylin-eosin stained section showing the ischaemic core of the lesion containing large-bodied astrocytes with an eosinophilic cytoplasm (cells indicated by black circles in the both expanded areas) and necrotic neuronal debris (red arrows, panel a); penumbra area (panel b) showing necrotic (white circles) and shapeless (black arrows) cells and intact neurons (green circle). MALDI MS images showing the altered distribution of NAPE (54:4) and GM2 (d18:1/18:0) in the affected area detected as deprotonated molecules at m/z 1004.768 (B) and 1382.805 (C), respectively.

