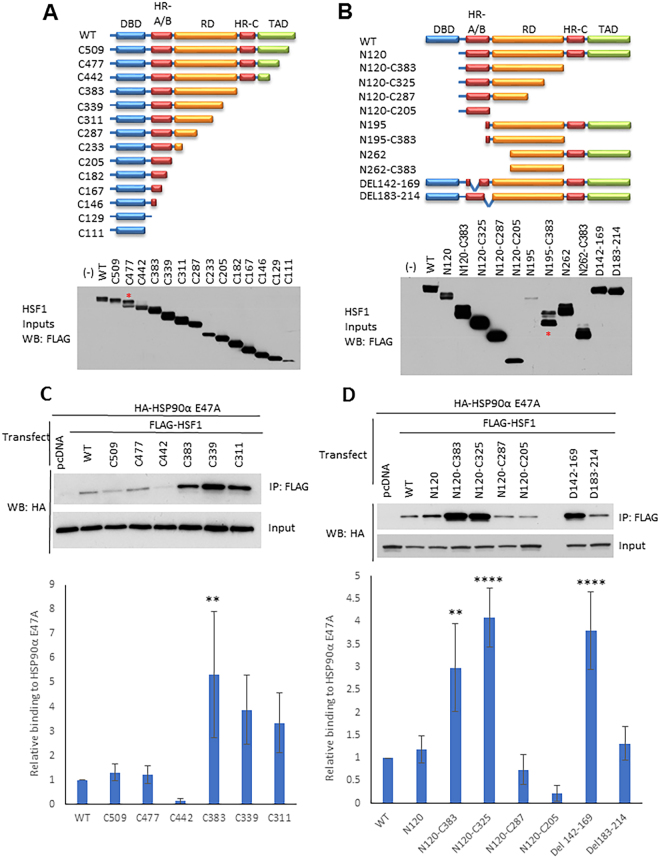
Figure 2.
Mapping interaction sites of “closed” HSP90 on HSF1. (A) Schema of FLAG-HSF1 C-terminal truncation constructs and their expression in HEK293 cells. The associated blot shows expression of each construct in HEK293 cells. Equal amounts of DNA were used for transfection. For construct C477, the upper band represents the intact truncation (designated by an asterisk), while the lower band is likely a proteolytic fragment. (B) Schema of FLAG-HSF1 N-terminal truncation and internal deletion constructs and their expression in HEK293 cells. The associated blot shows expression of each construct in HEK293 cells. Equal amounts of DNA were used for each transfection. Note the poor expression of N195. For N195-C383, the lower band represents the intact construct (designated by an asterisk); the upper band may reflect a post translationally modified peptide. (C) Interaction of selected FLAG-HSF1 C-terminal truncation constructs with HA-tagged HSP90α E47A. HEK293 cells were transfected with either FLAG-HSF1 constructs or FLAG-pcDNA control and HA-HSP90α E47A, and then analyzed by anti-FLAG (HSF1) IP followed by HA (HSP90α E47A) WB. Pull downs were performed in triplicate and western blots analyzed by densitometry. All HA IP bands were normalized to their respective FLAG IP signals (see Supplemental Figure 6, compilation of full blots) and then normalized to the WT signal. A one-way ANOVA utilizing multiple comparisons was performed to determine significant differences in HSP90 interaction between truncated HSF1 constructs and F-HSF1 WT. A representative blot is shown above the bar graph. Significance is indicated by asterisks (**Indicates p < 0.01). The p-value for the difference between C339 and WT interaction was 0.0534. (D) Interaction of FLAG-HSF1 N-terminal truncation and internal deletion constructs with HA- tagged HSP90α E47A: HEK293 cells were transfected and analyzed as in panel C. Significance is indicated by asterisks (**Indicates p < 0.01 and ****Indicates p < 0.0001). Full blots used to create cropped figure panels and for densitometry analysis for the bar graphs are shown in Supplementary Figure 6.

