
Figure 3.
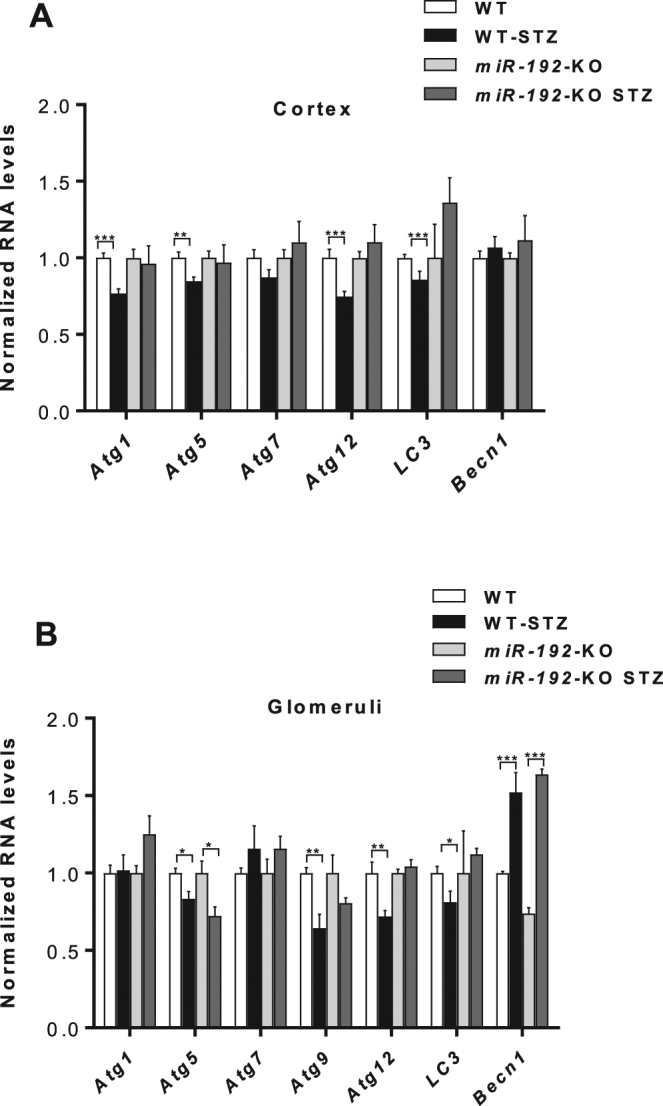
Decreased expression of key autophagy genes in kidneys of WT-STZ mice compared to WT controls is not observed for majority of genes in miR-192-KO-STZ mice compared to miR-192-KO control mice.qRT-PCR analysis of autophagy genes in (A) kidney cortex lysates and (B) kidney glomerular lysates; from WT control (n = 6) and WT-STZ (n = 5) mice and miR-192-KO control (n = 3) and miR-192-KO-STZ (n = 6) mice 22 weeks after induction of diabetes. *P < 0.05; **P < 0.01; ***P < 0.001.