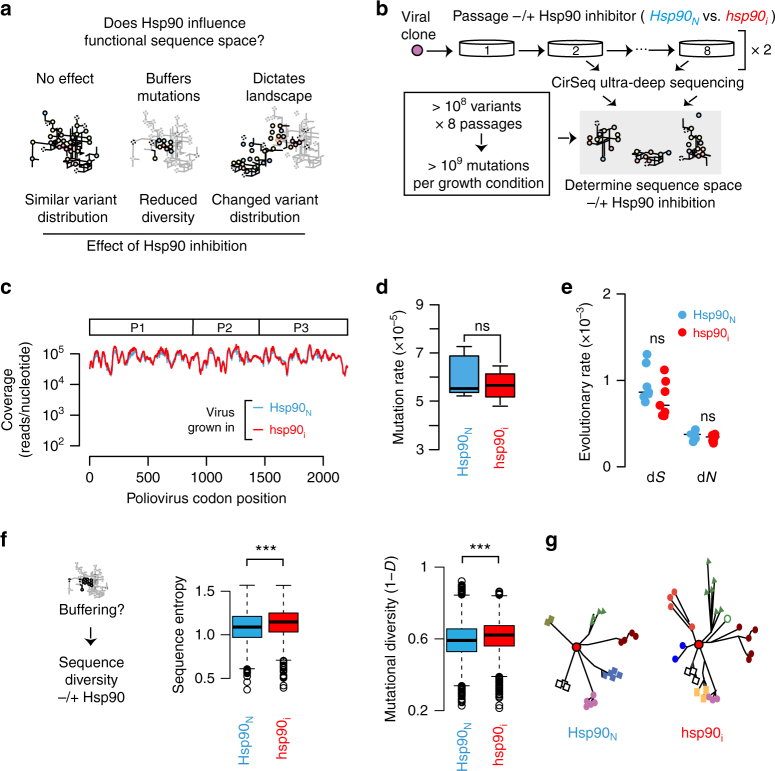
Fig. 2.
Globally assessing the influence of Hsp90 on protein sequence space. a Hypothetical models for how Hsp90 influences the functional sequence space of poliovirus: no-effect (left), buffers mutations (center), or dictates landscape (right). Schemes illustrate the respective predicted outcome of Hsp90 inhibition on sequence space for each model. Gray lines indicate available mutational networks while black lines indicated those that are present under the different proposed scenarios. b Experimental strategy to examine the effects of Hsp90 inhibition on poliovirus sequence space. Poliovirus was propagated over eight passages under normal or low Hsp90 conditions via GA treatment. Population samples containing >108 variants each were collected from passages 2–8 and subjected to CirSeq deep sequencing and analysis. c Average sequence coverage obtained with CirSeq across the poliovirus genome for all populations Hsp90N (blue trace) and hsp90i (red traces). d Mutation rates for the full virus genome in Hsp90N and hsp90i populations. e Evolutionary rates for P1 in Hsp90N and hsp90i populations (full genome in Supplementary Fig. 4c). f Does Hsp90 buffering lead to reduced P1 sequence diversity in hsp90i populations? Sequence entropy (left panel) and mutational diversity (right panel) for P1 coding region is higher for hsp90i than for Hsp90N populations analyzed by CirSeq. g Representation of distinct sequence diversity for P1 from Hsp90N and hsp90i virus populations. The original master sequence (red, middle circle) gives rise to variants (different colors and symbols) through mutation. For boxplots, the center line represents the median, the bound box the interquartile range, and the whiskers 1.5× the interquartile range. Significance: ns, not significant (p > 0.05); ***p < 0.005 by the Mann–Whitney–Wilcoxon test

