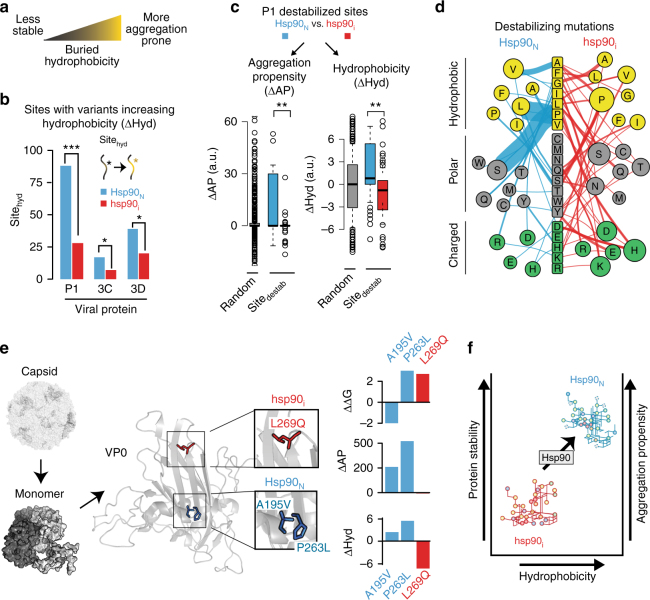
Fig. 4.
Hsp90 mediates a trade-off between stability and aggregation propensity. a Effect of buried hydrophobicity on protein stability and aggregation propensity. b Sites with increased hydrophobic variants (Sitehydro) in Hsp90N and hsp90i populations. c Properties of P1 destabilized sites (Sitedestab) from Hsp90N and hsp90i: aggregation propensity (left panel) and hydrophobicity (right panel). d Distinct nature of destabilizing variants (Sitedestab) in P1 of Hsp90N and hsp90i populations. Original amino acid is indicated in the middle. Color indicates side-chain properties: Yellow, hydrophobic; gray, polar; green, charged. Mutations to specific residues in Hsp90N (left) and hsp90i (right) are indicated, where circle size indicates mutation occurrence. The width of lines connecting each mutation represents the number of occurrences for each variant. e Exemplar P1 variants enriched in Hsp90N and hsp90i populations. Location in P1 folded structure and effects on stability, aggregation propensity, and hydrophobicity are indicated. Mutations A195V and P263L (blue) observed in Hsp90N, and L269Q (red) in hsp90i. Structure from 2PLV, with VP2 monomer, and assembled capsid indicated. f Schematic effect of Hsp90 on sequence space. Hsp90 allows variants to explore a region in sequence space of increased hydrophobicity and aggregation propensity, but also of increased stability. Lower Hsp90 constrains sequence space variants to a region of reduced stability, hydrophobicity, and aggregation propensity. For boxplots, the center line represents the median, the bound box the interquartile range, and the whiskers 1.5× the interquartile range. Significance: *p < 0.05; **p < 0.01; ***p < 0.005 by two-tail Fisher’s exact test or Mann–Whitney–Wilcoxon test

