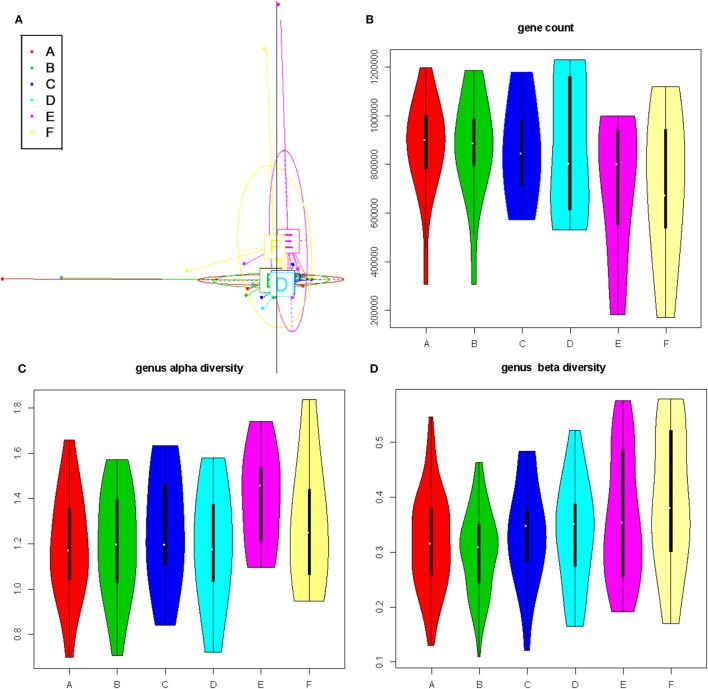
Figure 2.
The impact of diet pattern on general composition, richness, and diversity of the gut microbiota. (A) Principal component analysis based on the gut bacterial gene profile. (B) Violin plots showing the richness at the gene level for each subgroup. (C,D) Violin plots showing the alpha- and beta-diversity at the genus level, for each subgroup.

