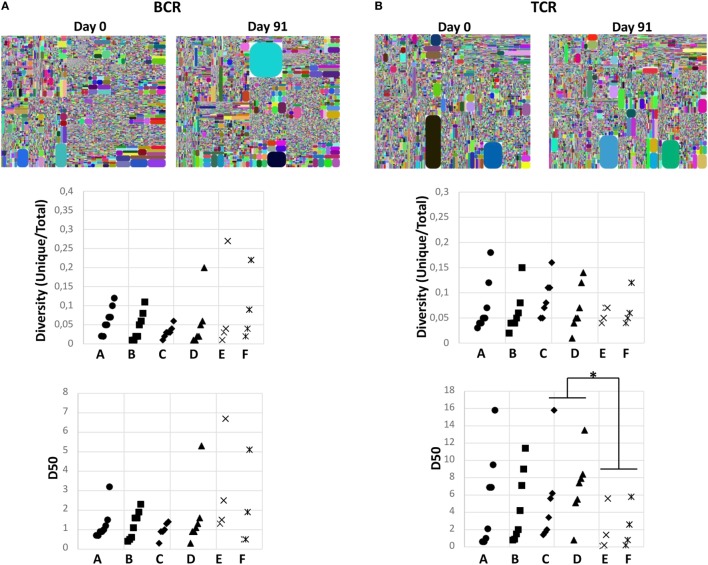
Figure 6.
Impact of diet pattern on the diversity of immune system. Diversities of B-cell receptor (A) and T-cell receptor (B) were analyzed in all study subjects from the different groups. Representative tree map from samples collected at days 0 and 91 from one individual in the study group are shown on top. Each dot represents one unique complementary determining regions 3 (CDR3)-V-J combination, whereas the size illustrates the number of sequences of each CDR3-V-J combination. Changes in D50 values and diversity (unique/total CDR3s) between days 0 and 91 in each group are shown in the middle and at the bottom panels, respectively. Each line represents one individual. Statistical calculations were performed by Wilcoxon signed-rank test. *p < 0.05.

