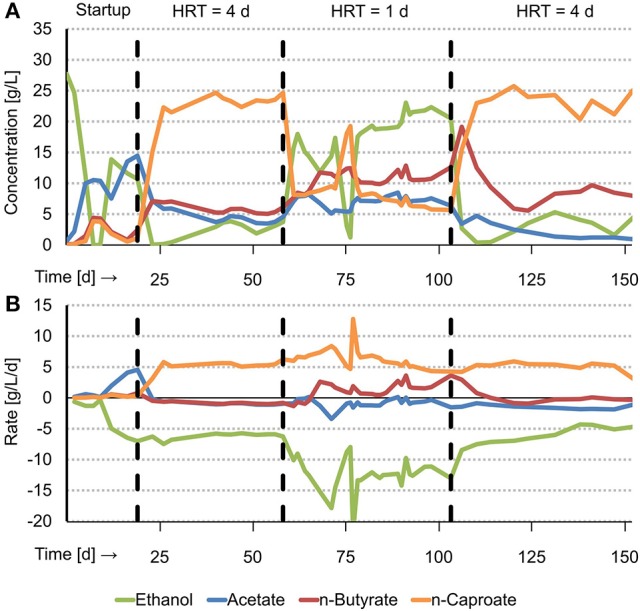
Figure 1.

Graphical summary of experimental results with concentrations over time (A) and net production and consumption rates over time (B). T = 30°C, pH = 6.8, V = 1 L, CO2 loading rate = 1.0 LCO2/L/d.

Graphical summary of experimental results with concentrations over time (A) and net production and consumption rates over time (B). T = 30°C, pH = 6.8, V = 1 L, CO2 loading rate = 1.0 LCO2/L/d.