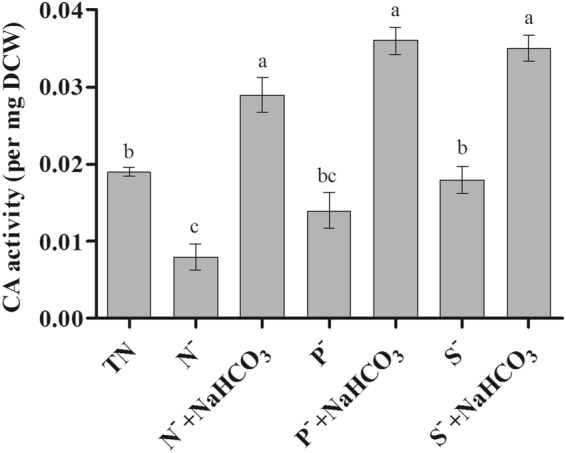
Figure 6.

Changes in carbonic anhydrase activity of D. salina with bicarbonate under nutrient deficit conditions. All values are expressed as Mean ± SD (n = 3). Values with different letters represent significantly differ at p < 0.05 between the groups. Total Nutrient (TN); Nitrate deficit (N−); Nitrate deficit with bicarbonate (N− + NaHCO3); Phosphate deficit (P−); Phosphate deficit with bicarbonate (P− + NaHCO3); Sulphate deficit (S−); Sulphate deficit with bicarbonate (S− + NaHCO3).
