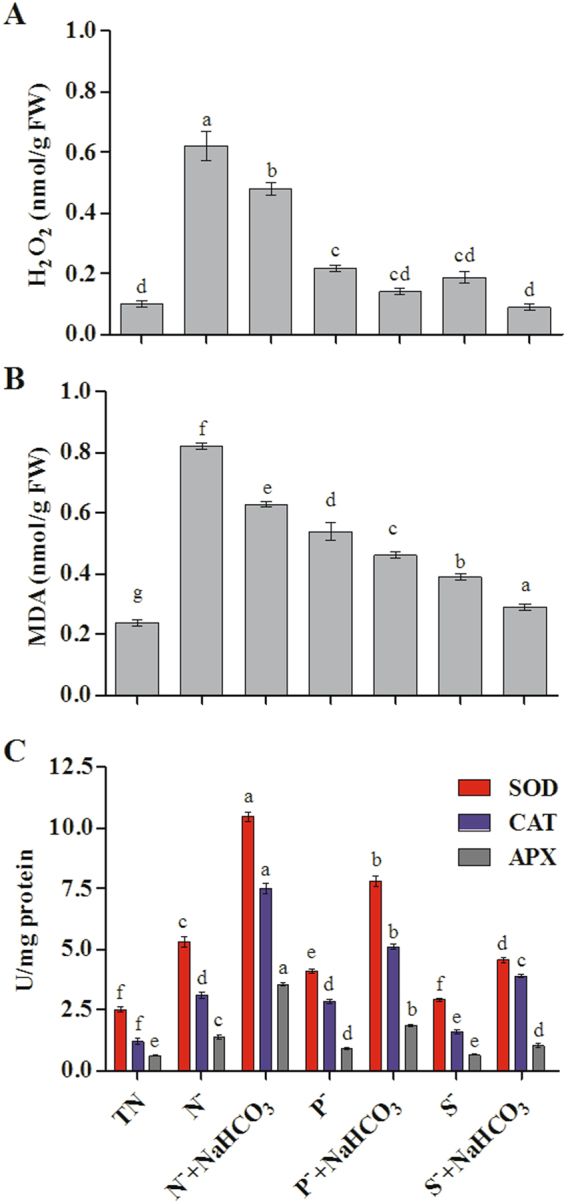
Figure 7.

Production of ROS (A), lipid peroxidation (B) and antioxidant acitivities of SOD, CAT and APX (C) of D. salina with bicarbonate under nutrient deficit conditions. All values are expressed as Mean ± SD (n = 3). Values with different letters represent significantly differ at p < 0.05 between the groups. Total Nutrient (TN); Nitrate deficit (N−); Nitrate deficit with bicarbonate (N− + NaHCO3); Phosphate deficit (P−); Phosphate deficit with bicarbonate (P− + NaHCO3); Sulphate deficit (S−); Sulphate deficit with bicarbonate (S− + NaHCO3).
