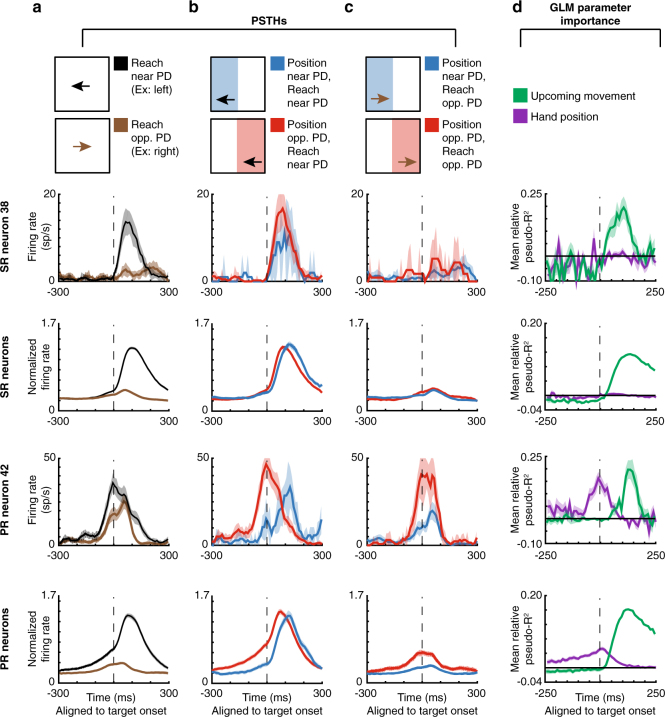
Fig. 3.
PMd PSTHs and GLM results. First row: A selected-response (SR) neuron. Second row: Normalized averages of SR neurons. Third row: A potential-response (PR) neuron. Bottom row: Normalized averages of PR neurons. a–c Peristimulus time histograms (PSTHs) for PMd neurons, aligned to target onset. Shaded areas represent SEMs. a PSTHs of reaches near the preferred direction (PD; black) vs. opposite the PD (brown). b PSTHs of reaches near the PD, with a starting hand position near the PD (lower probability of moving near the PD; blue) vs. a position opposite the PD (higher probability of moving near the PD; red). c PSTHs of reaches opposite the PD, with a starting hand position near the PD (blue) vs. a position opposite the PD (red). d We utilized a generalized linear model (GLM) to control for confounds in the PSTHs, including different distributions of starting positions, upcoming movements, and previous movements. Here, we show the importance of parameters in the GLM, across time, for PMd neurons. We show mean relative pseudo-R2 over time, of the upcoming movement (green) and hand position (purple) covariates. For the 2nd and bottom row, shaded areas represent SEMs across neurons. For individual neurons, shaded areas represent the standard deviation across bootstraps

