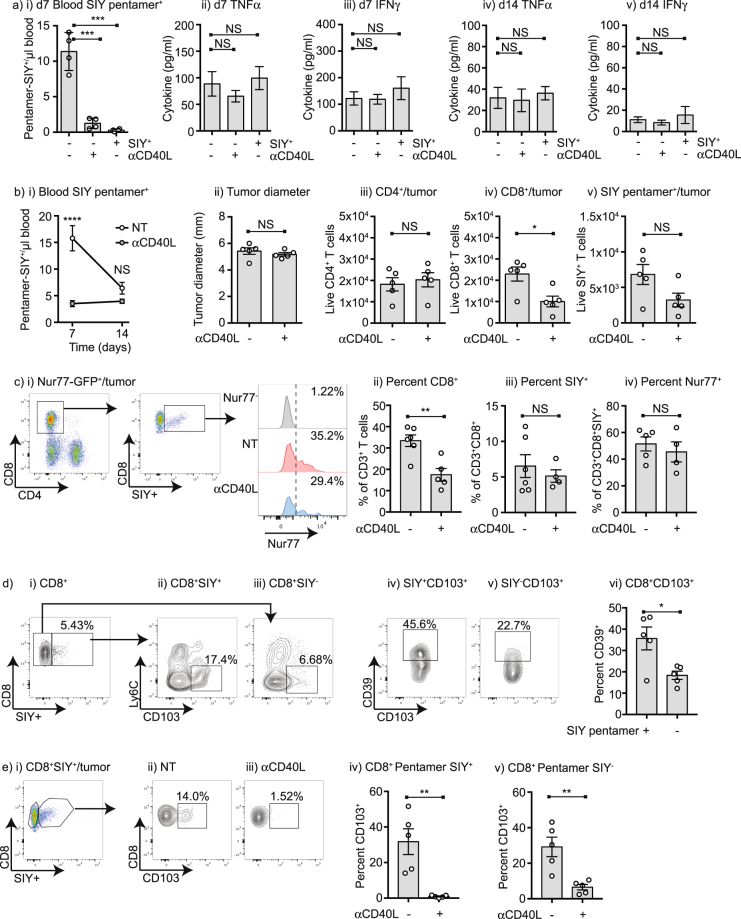
Figure 4.
Anti-CD40L at tumor implantation prevents the development of Trm in the tumor environment. (a) i) C57BL/6 mice were implanted with Panc02-SIY tumors on d0 and left untreated; implanted with Panc02-SIY tumors and treated with 100 µg anti-CD40L on d0, d1 and d2; or Panc02-SIY tumors were implanted into SIY+ mice that were tolerant to SIY. Graph shows SIY-specific pentamer binding cells in the peripheral blood 7d following tumor implantation. Tumors were harvested on ii-iii) d7 or iv-v) d14 following implantation and analyzed for tumor cytokines by multiplex bead assay. Graphs show levels of TNFα or IFNγ in the tumors. (b) C57BL/6 mice were implanted with Panc02-SIY tumors on d0 and left untreated or treated with 100 µg anti-CD40L on d0, d1 and d2. i) Mice were analyzed for SIY-specific cells in the peripheral blood on d7 and d14 following tumor challenge. ii) Tumor size at d14 following challenge. d14 tumors were harvested and analyzed for the number of tumor infiltrating iii) CD4+ T cells, iv) CD8+ T cells, v) SIY-specific T cells. (c) C57BL/6 Nur77-GFP− mice or Nur77-GFP+ mice were implanted with Panc02-SIY tumors on d0 and left untreated or treated with 100 µg anti-CD40L on d0, d1 and d2. i) CD8+SIY pentamer+ T cells were analyzed for Nur77-GFP expression. Graphs show the percent of ii) CD8+ T cells, iii) SIY+ T cells and iv) Nur77-GFP+ T cells. (d) C57BL/6 mice were implanted with Panc02-SIY tumors and i) tumor-infiltrating CD8+ T cells were gated into ii) SIY pentamer+ or iii) SIY pentamer- cells, and analyzed for Ly6C and CD103 expression. CD39 expression in v) CD8+SIY pentamer+ CD103+ T cells, vi) CD8+SIY pentamer− CD103+ T cells. vii) Summary of CD39+ T cells. (e) C57BL/6 mice were implanted with Panc02-SIY tumors on d0 and left untreated or treated with 100 µg anti-CD40L on d0, d1 and d2. i) Tumor-infiltrating CD8+SIY pentamer+ T cells were analyzed for CD103 expression in ii) untreated (NT) and iii) anti-CD40L treated animals. Summary of CD103+ proportion in iv) CD8+SIY pentamer+ CD103+ T cells, v) CD8+SIY pentamer- CD103+ T cells. Each symbol represents one animal. Key: NS = not significant, *p < 0.05; **p < 0.01; ***p < 0.001; ****p < 0.0001.

