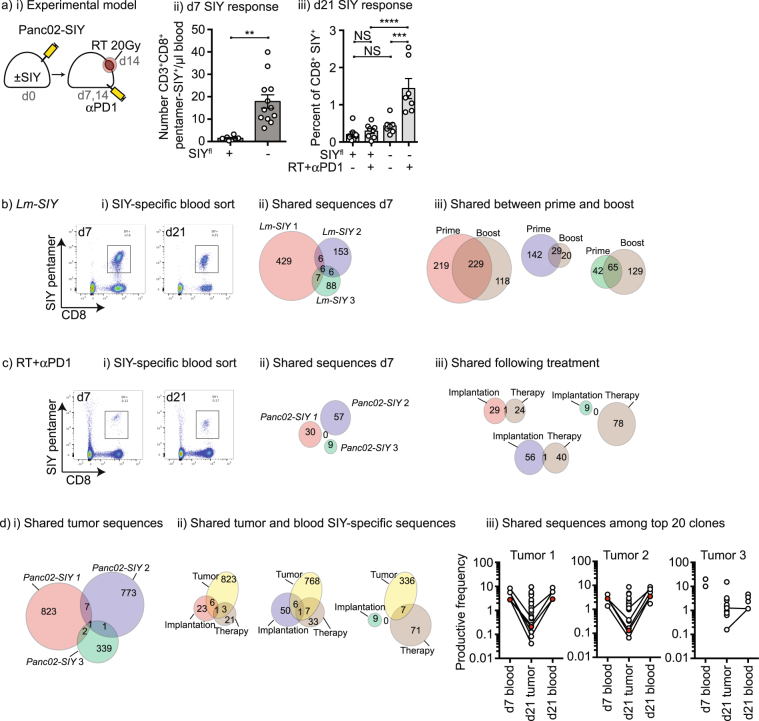
Figure 6.
T cell responses generated by treatment are different from those generated by implantation. (a) i) Panc02-SIY tumors were implanted into wild-type mice or SIY+ mice and treated with anti-PD1 on days 7 and 14 and RT on d14. Blood was harvested from groups on ii) d7 and iii) d21 for analysis of SIY-specific T cells in the peripheral blood using SIY-pentamers. (b) i) C57BL/6 mice were vaccinated with Lm-SIY on d0 and d14, and peripheral blood was harvested on d7 and d21. SIY-specific CD8 T cells were sorted from the peripheral blood based on SIY-pentamer binding and sorted cells underwent TCRSeq to identify SIY-responsive clones. ii) The number of distinct SIY-specific clones in each animal at d7 following vaccine priming is shown, along with shared clones. Circle areas are approximately to scale. iii) The number of clones shared within individual animals between prime (d7) and boost (d21). Circle areas are approximately to scale. (c) i) Panc02-SIY tumors were implanted into C57BL/6 mice and treated with anti-PD1 on days 7 and 14 and RT on d14. Blood was harvested from mice on d7 and d21 and on d21 the tumor was also harvested. SIY-specific CD8 T cells were sorted from the peripheral blood based on SIY-pentamer binding and sorted cells underwent TCRSeq to identify SIY-responsive clones. ii) The number of distinct SIY-specific clones in each animal at d7 following vaccine priming is shown, along with shared clones. Circle areas are approximately to scale.0 iii) The number of clones shared within individual animals generated following implantation (d7) and treatment (d21). Circle areas are approximately to scale. (d) i)The number of distinct clones identified following TCRSeq of unfractionated tumors harvested at d21 is shown, along with shared clones. Circle areas are approximately to scale. ii) The number of clones shared between the tumor and those in the peripheral blood following implantation and following treatment. Circle areas are approximately to scale, but tumors are not shown to scale. iii) The top 20 most abundant clones in the peripheral blood at d7 and d21, and the top 20 most abundant clones in the tumor at d21 are shown. Lines linking symbols denote shared clones. Clones highlighted in red are found in all three samples. Key: NS = not significant, *p < 0.05; **p < 0.01; ***p < 0.001; ****p < 0.0001.

