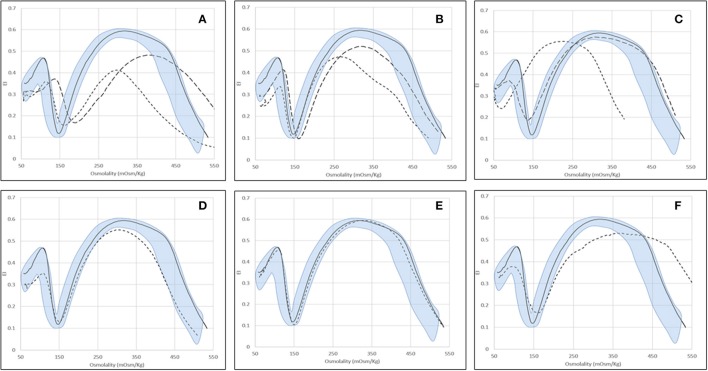
Figure 2.
Examples of typical osmoscan profiles in hemolytic anemias. Continuous line represents a daily control and shaded area the control range curve. (A) HS = hereditary spherocytosis: HS1 ( ), HS2 (
 ); (B) HE = hereditary elliptocytosis: HE1 (
 ), HE2 (
 ); (C) HSt = hereditary stomatocytosis: HSt-PIEZO1 (
 ), HSt-KCNN4 (
 ); (D) CDAII (non-splenectomised) = congenital diserythropoietic anemia type II; (E) PKD (non-splenectomised) = pyruvate kinase deficiency; (F) GPI = glucosephosphate isomerase deficiency.

