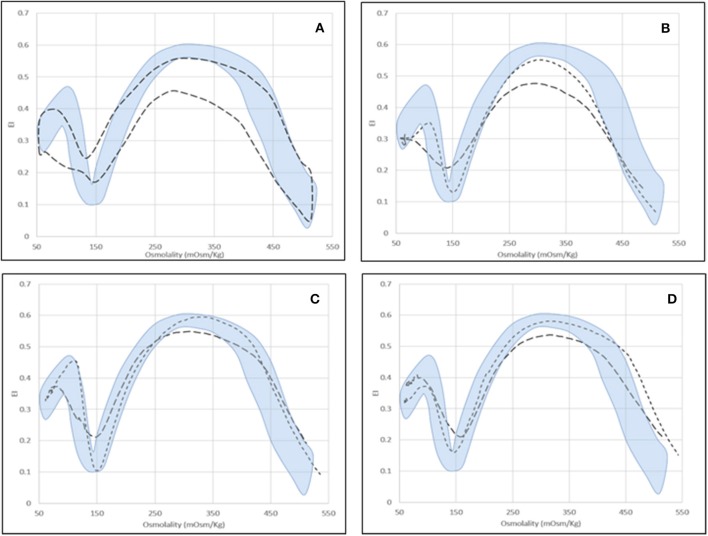
Figure 3.
Osmoscan profile in splenectomized patients. (A) Shaded area = control range curve; Dashed area = splenectomised patients (seven affected by PKD, two by Pyr5′N deficiency and seven by CDAII); (B) CDAII: non-splenectomised ( ), splenectomised (
 ); (C) PKD: non-splenectomised (
 ), splenectomised (
 ); (D) Pyr5′N deficiency: non-splenectomised (
 ), splenectomised (
 ).
).

