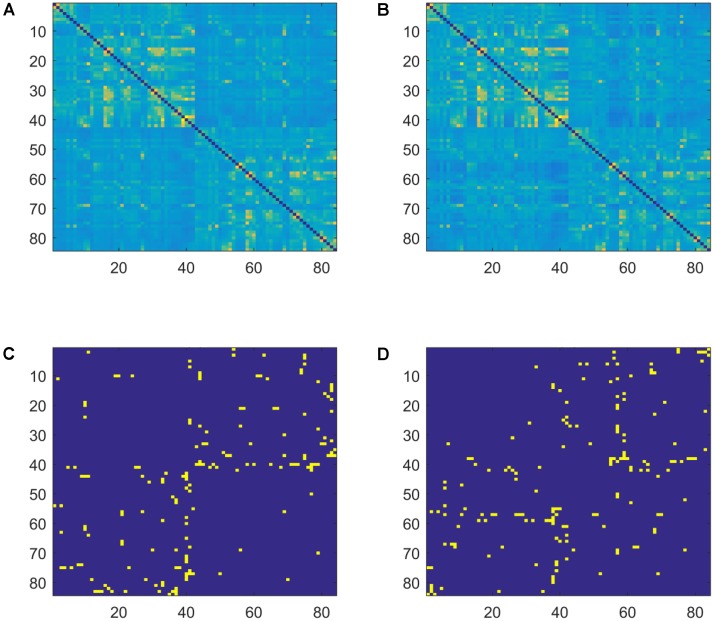
FIGURE 1.
Weighted and sparse (MST) adjacency matrices for the two groups (AWS and control) in the beta2 band. (A) Averaged weighted adjacency matrix for controls. (B) Averaged weighted adjacency matrix for AWS. (C) Average MST adjacency matrix for controls. (D) Average MST adjacency matrix for AWS. Different patterns are visually observable between the MST graphs.

