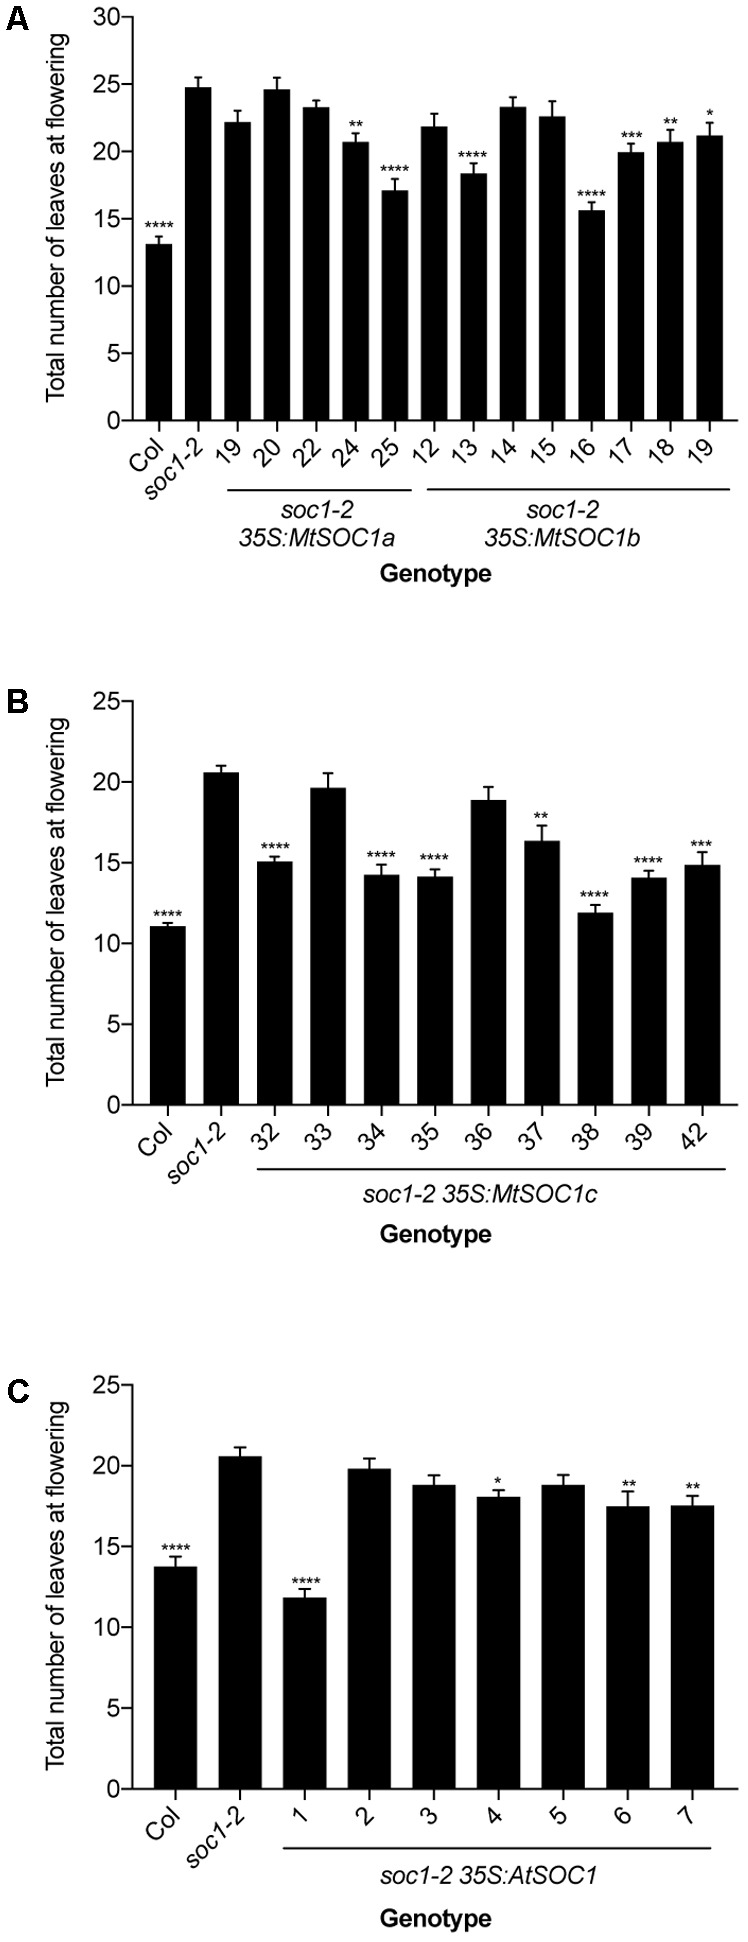
FIGURE 2.

Complementation of late-flowering Arabidopsis soc1-2 (Col) mutants by Medicago SOC1 genes. Flowering time phenotypes of genetically independent transgenic plant lines ectopically expressing SOC1 transgenes in the soc1-2 mutant background. (A) Flowering time of homozygous T3 transgenic lines harboring 35S:MtSOC1a or 35S:MtSOC1b cassettes. (B) Flowering time of homozygous T3 transgenic lines harboring a 35S:MtSOC1c cassette. (C) Flowering time of T2 transgenic lines harboring a 35S:AtSOC1 cassette. Data are mean ± SD of at least 12 plants grown under 16 h illumination at ∼120 μE.m2.s-1 light intensity at 22°C day time/18°C night time. Statistically significant differences between means of soc1-2 versus each other genotype were determined by one-way ANOVA. Asterisks, where annotated, denote P-values. ∗P ≤ 0.05, ∗∗P ≤ 0.01, ∗∗∗P ≤ 0.001, ∗∗∗∗P ≤ 0.0001.
