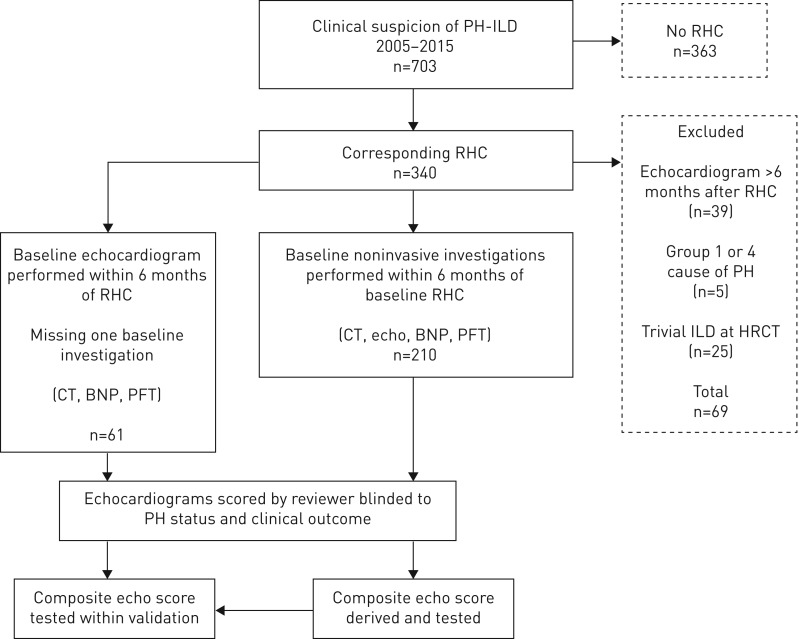
FIGURE 1.
Cohort identification and exclusion. A flow diagram describing the methodology of the study, from patient identification and selection to the development and validation of the echocardiography (echo) score in the derivation (n=210) and validation (n=61) cohorts; the latter derived from the same population over the same time period, but with some missing brain natriuretic peptide (BNP) and pulmonary function testing (PFT) data from the time of right heart catheterisation (RHC). CT: computed tomography; PH: pulmonary hypertension; ILD: interstitial lung disease; HRCT: high-resolution CT.

