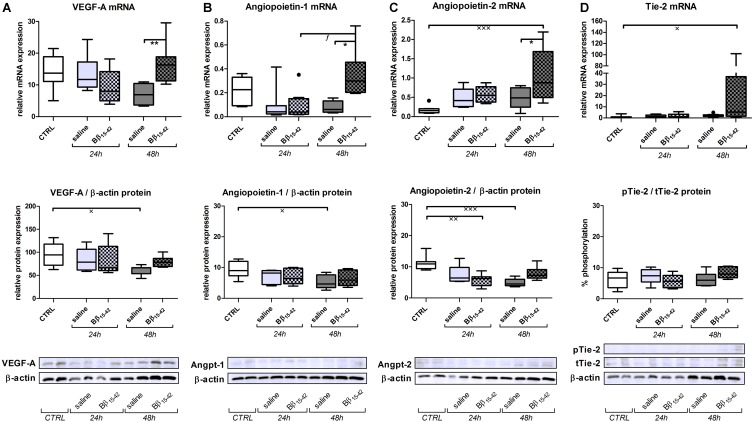
FIGURE 3.
Bβ15-42 favors angiogenesis. In order to investigate angiogenetic signaling within IR injury, we performed RT-PCR analyses relative to 18S (upper graphs) and western blot analyses relative to β-actin (middle graphs and lower image) of relevant genes and proteins in kidney tissue homogenates (n = 8 per group) (A–D). ∗ Significant difference between Bβ15-42 and saline treated mice at one point in time; x significant difference to CTRL; f significant difference in the time course within Bβ15-42 treated or saline treated mice. ∗/x/f p < 0.05; ∗∗/xxp < 0.01; xxxp < 0.001.

