FIGURE 4.
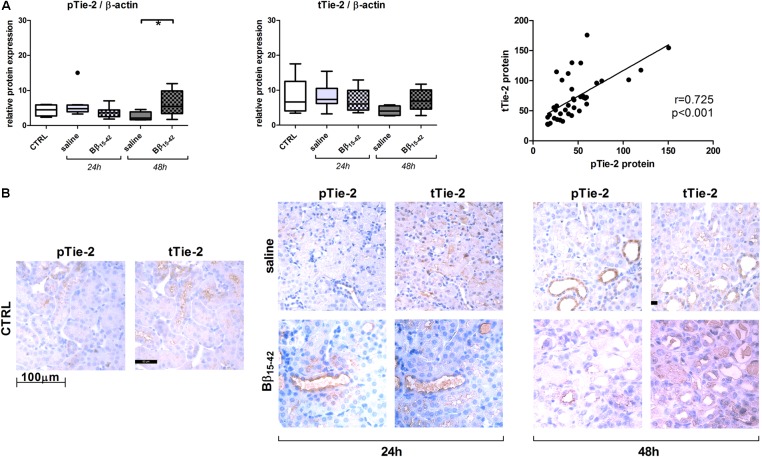
Protein expression and immunhistochemical staining of kidney sections on phosphorylated Tie-2 and total Tie-2. Protein expression of phosphorylated Tie-2 (pTie-2) and total Tie-2 (tTie-2) each relative to β-actin and their correlation (A). Representative juxtaposed micrographs of phosphorylated Tie-2 (pTie-2) and total Tie-2 (tTie-2) stained kidney sections within the cortex and outer medulla of control, Bβ15-42 and saline treated mice at 24 and 48 h IR (B). ∗p < 0.05.

