Figure 2.

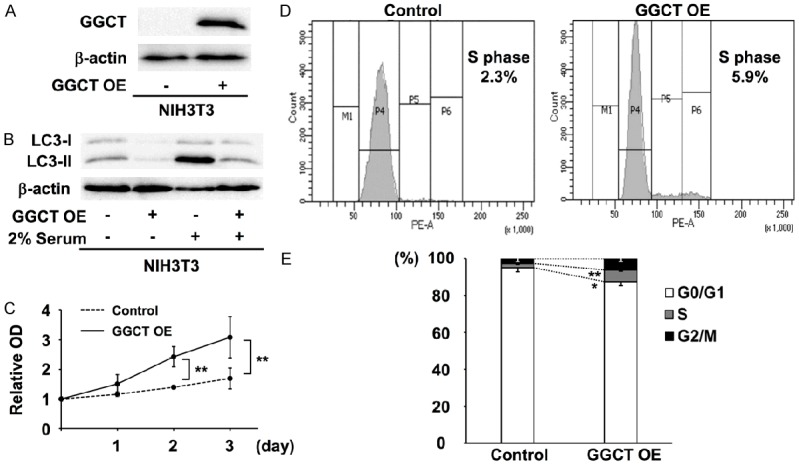
Overexpression of GGCT suppresses autophagy and promotes proliferation. (A) Western blot analysis of GGCT-overexpressing cells. (B) Western blot analyses of LC3 in control and GGCT-overexpressing NIH3T3 cells cultured in (-) 10% or (+) 2% serum-containing medium. (C) Growth curves of control and GGCT-overexpressing (OE) NIH3T3 cells cultured in 2% serum-containing medium. (D and E) Cell cycle analysis of control and GGCT-overexpressing NIH3T3 cells in DMEM supplemented with 2% FBS. Representative histograms (D) and quantified distribution (E) are shown. (*P < 0.05, **P < 0.01).
