
Figure 5.
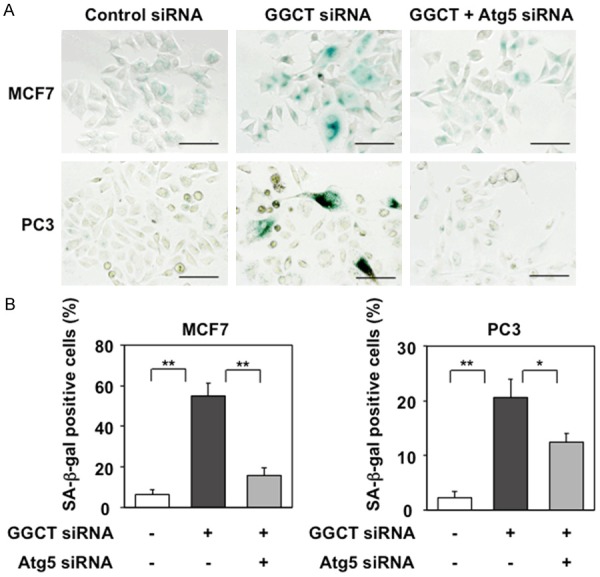
Blockade of autophagy inhibits cellular senescence induced by GGCT knockdown. A: Representative images of SA-β-Gal staining of MCF7 and PC3 cells 4 days post-transfection with the indicated siRNAs. Scale bar, 100 μm. B: The number of SA-β-Gal-positive cells was counted and the positive cell: total cell ratios are shown. (*P < 0.05, **P < 0.01).